Home
Signals
View all Signals
Learn how long-term climate trends are linked to new extremes.
More
Drought icon
Drought
More
Fire icon
Fires
More
Earth systems icon
Earth Systems
More
Floods icon
Floods
More
Heat icon
Heat
More
Hurricanes icon
Hurricanes
More
Resource Hub
All Resources
More
Events
A database of events and their links to climate change.
More
Headlines
Climate change impact stories in the news.
More
Real Time Data
A searchable gallery of climate change monitors relaying real-time data.
More
Science Sources
A searchable database of climate science reports.
More
Attribution
What is climate attribution?
Climate change attribution tells us how much of the credit or risk for a trend or event should go to human-caused climate change.
More
Report: Fingerprints Everywhere 2018
Studies since the 1990s show human-caused climate change directly influenced many recent trends and events.
More
Attribution science database
An updating database of studies that find the fingerprint of human-caused climate change on observed trends and events.
More
 
Climate Change Impacts Explained in Real Time

Map: Atlantic Sea Surface Temperature Anomaly, September 20, 2017

by NOAA/NWS/NCEP/EMC

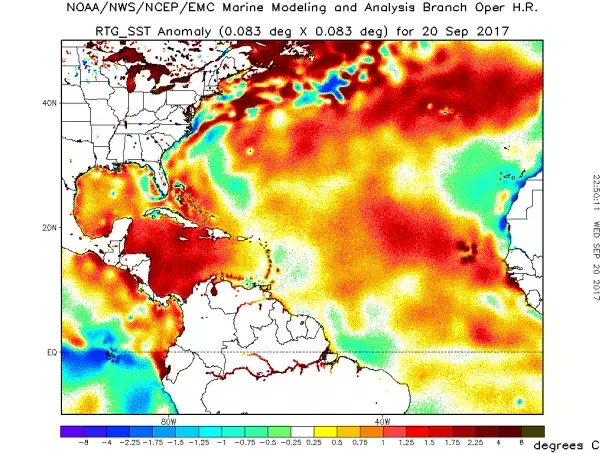
Hurricane Maria re-intensified as it approached the Dominican Republic amid SSTs that were 0.5-1.25°C above average.


Source information

NOAA/NCEP real-time, global, sea surface temperature (RTG_SST_HR) analysis homepage

September 20, 2017 SST anomaly map

Archive of all September 20, 2017 high resolution data

Archive of all SST high resolution data [Sept 28, 2012 - ]

Analysis details here

  • Climate Signals
  • All Signals
  • Earth Systems
  • Heat
  • Drought
  • Fires
  • Hurricanes
  • Floods
  • Resource Hub
  • Events
  • Headlines
  • Climate Science
  • Real Time Data
  • About Us
  • Privacy Policy
  • Related Sites
  • Site built by 89up