Map: Change in Chilean Wildfires during the Mega-Drought (2010-2014)
by Center for Climate and Resilience Research | National Forestry Corporation
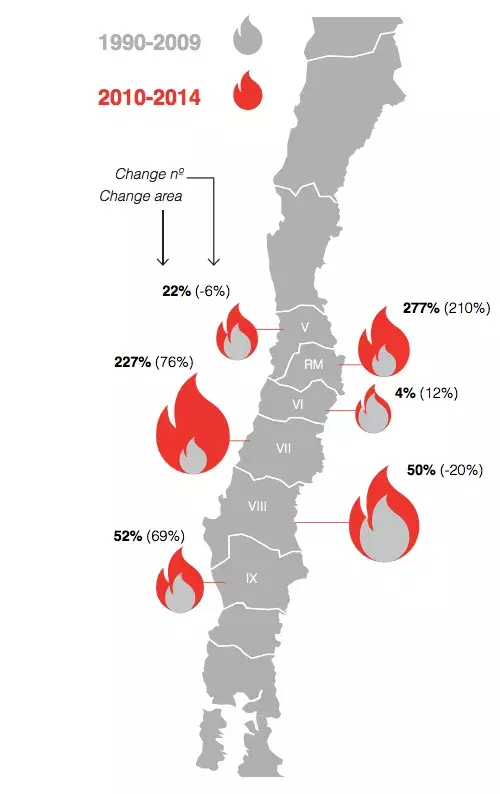
The size of the flame symbols is proportional to the total area burnt annually by large forest fires (over 200 hectares) in each Region during the mega-drought (2010-2014, red symbols) and base period (2000-2009, gray symbols). The numbers indicate the percent increase in burnt area. Shown in parenthesis is the percent increase in number of large fires during 2010-2014 and 2000-2009.
