Map: Change in high streamflow in spring
by Climate Central
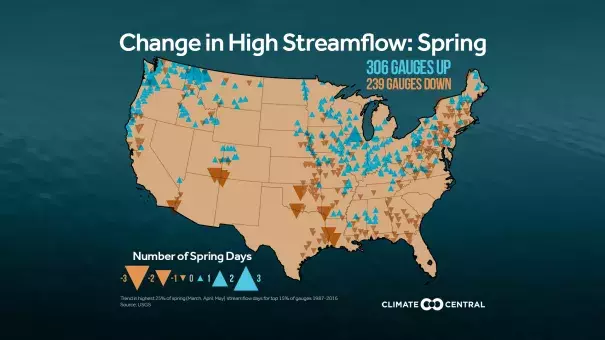
Daily discharge data from 1987-2016 was gathered from over 2,100 USGS stream gauges, representing the active gauges in the Federal Priority Streamgages program. Gauges missing more than 10 percent of daily observations were removed. High streamflow was defined as being in the top 25 percent of observations, or what the USGS defines as “above normal.”
To reflect the most active waterways, gauges that represented the highest 15 percent of average annual streamflow in the U.S. were displayed in the graphics above. Future analyses will determine where there may be additional seasonal trends in high stream flow.
