Map: Future CONUS percent changes in mean total nitrogen load
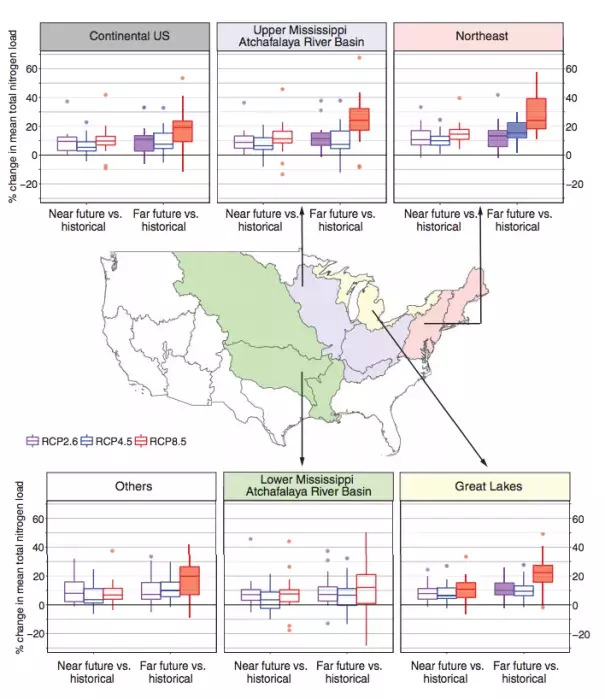
Percent changes in mean total nitrogen load within large regions within the continental United States for the RCP2.6 “mitigation,” RCP4.5 “stabilization,” and RCP8.5 “business-asusual” emission scenarios. For a given model, total nitrogen load is first averaged for each 30-year period (historical, near future, far future), each scenario, and each region (using an areaweighted average of contributing watersheds), and these values are then expressed as a percent change in projected total nitrogen load within a given region, period, and model. Box plots represent the spread across the examined models (16 for RCP2.6, 20 for RCP4.5, and 21 for RCP8.5) for specific periods and scenarios, with outliers marked as dots. Filled box plots highlight regions with a robust change in total nitrogen load (i.e., more than 50% of the models show a significant change and more than 80% of the models agree on the sign of change). Gray outlines show the two-digit hydrologic unit (HUC2) regions for reference (fig. S1).
