Map: Min Temperature Anomaly June 5, 2016
by Climate Prediction Center/ NOAA
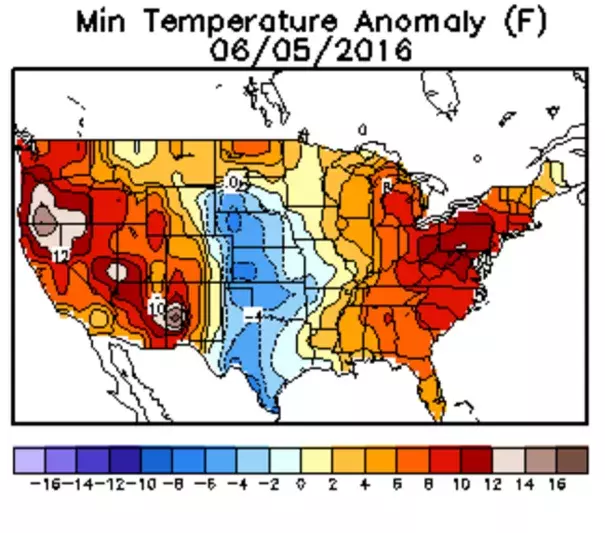
River Forecast Centers ~5000 stations per day, including ~1500 stations from the Hydrologic Automated Data System (except above 5km altitude), and Climate Assessment Data Base ~several hundred stations per day. Climatologies used to calculate the anomalies were updated to use the 1981-2010 climatology dataset as of August 5, 2011.
