Map: Modeled surface velocities for the entire continent of Antarctica
Over the past 22 years, the global sea level has risen about seven centimeters—and according to the Intergovernmental Panel on Climate Change, sea levels could rise as much as 21 feet over the next hundred years. The sea level is rising partly because of higher ocean temperatures, which cause seawater to expand, and partly due to melting ice sheets, which releases water into the world’s oceans. Scientists can observe the rapidly evolving ice sheets using satellites and airborne instruments, but predicting future changes is challenging. Researchers are working hard to understand the factors contributing to sea level rise in order to improve predictions that can help coastal communities plan for and mitigate the effects.
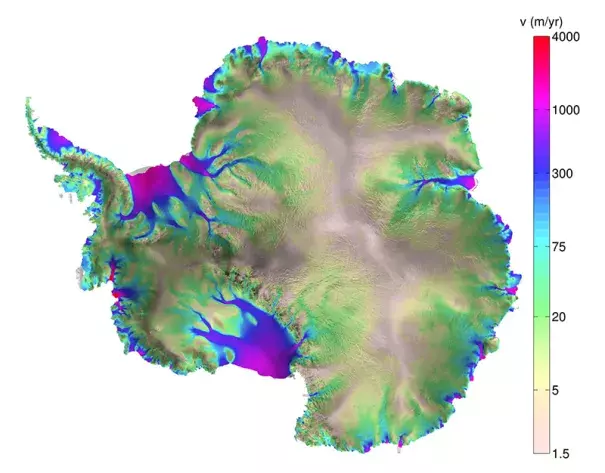
To help improve projections of ice sheet evolution, scientists at NASA’s Jet Propulsion Laboratory and the University of California, Irvine, are using the Ice Sheet System Model (ISSM) to run large-scale ice flow simulations on the Pleiades supercomputer at the NASA Advanced Supercomputing (NAS) facility. According to ISSM Project Lead Eric Larour, the main goals of the project are to simulate the evolution of surface flow velocity and ice elevation for an ice sheet and to understand the impact on global sea level. This visualization from a simulation run on Pleiades represents the modeled surface velocities for the entire continent of Antarctica—which, along with Greenland, account for about 2/3 of sea level rise. The brown and green colors represent relatively slow ice surface velocities (fractions of meters per year to a few meters per year). Blue and purple represent much faster velocities, ranging up to 3,000 meters per year.
ISSM can assimilate vast amounts of information from many sources, including regional climate models, NASA satellite observations, and bedrock topography, while incorporating continually changing physical processes such as glacier calving and ice-ocean/ice-bed interactions.
—Michelle Moyer, NASA/Ames
Image: Morlighem et al, Journal of Geophysical Research[1]
