Map: Rate of Temperature Change in the United States, 1901-2014
by Environmental Protection Agency, NOAA
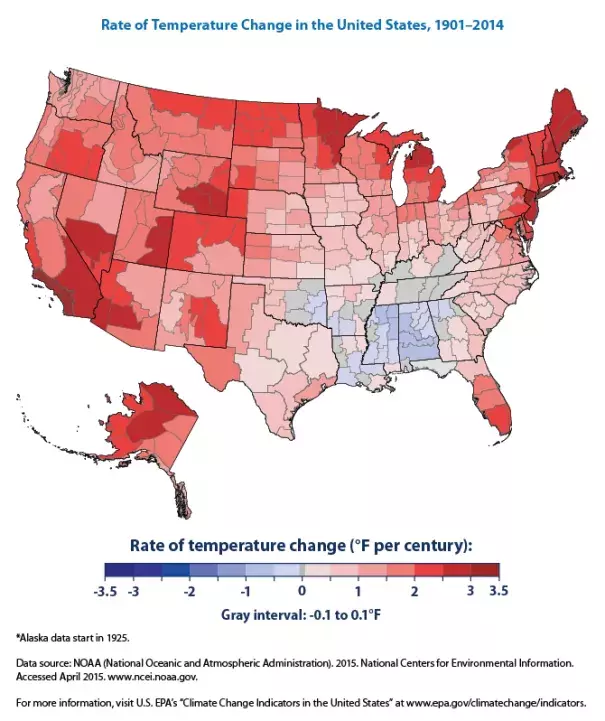
This figure shows how annual average air temperatures have changed in different parts of the United States since the early 20th century (since 1901 for the contiguous 48 states and 1925 for Alaska). The data are shown for climate divisions, as defined by the National Oceanic and Atmospheric Administration.
