Map: Summary of observed flood changes in Europe
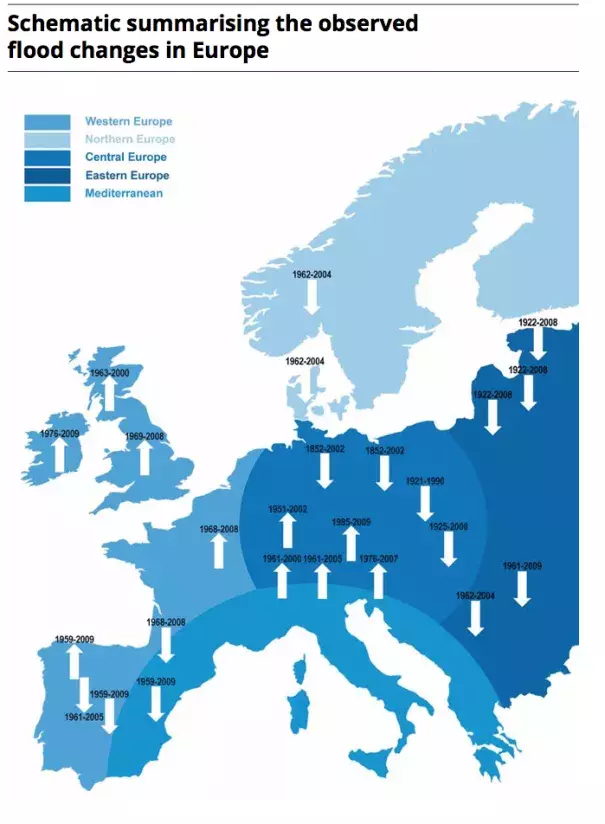
The schematic summarizes the outcomes of many different studies analyzed by Hall et al[1], which used different and not directly comparable change analysis methods and time periods. The arrows in the schematic indicate the majority of trends, including regions with weak and/or mixed change patterns. Areas with no or inconclusive studies owing to insufficient data (e.g. Italy) and inconclusive change signal (e.g. Sweden) are not shown.
Studies included in the inventory by Hall and colleagues converge in some broad-scale overall patterns, which can be summarized as follows:
- In western Europe:
- A decrease in maximum annual flows in central Spain and the Douro Basin;
- No consistent change in most regions in France, with the exceptions of increasing flood peaks in the northeast, decreasing high flows in the Pyrenees, and earlier snowmelt-related floods in the Alps;
- Increasing trends in annual high flows in Ireland and the United Kingdom;
- In Scandinavia, mixed patterns from which no conclusive overall pattern could be identified;
- In central Europe, an overall tendency towards increasing large floods, and in central, west and south Germany, Switzerland and Hungary increasing trends for large floods. Austria shows mixed results across the country, whereas in other parts of central Europe no conclusive trends could be identified;
- In eastern Europe, a majority of identified trends for decreasing annual maxima;
- Decreasing trends in the Mediterranean
These trends are, in most cases, not very firm and the uncertainties are high as a result of different monitoring approaches used, differences in underlying hydrological processes and different observation periods. As Hall et al emphasize: 'don't regard the schematic as a stand-alone outcome, interpret it in combination with the original literature'.[2]
