Map: Trend highest daily mean temperature of the year
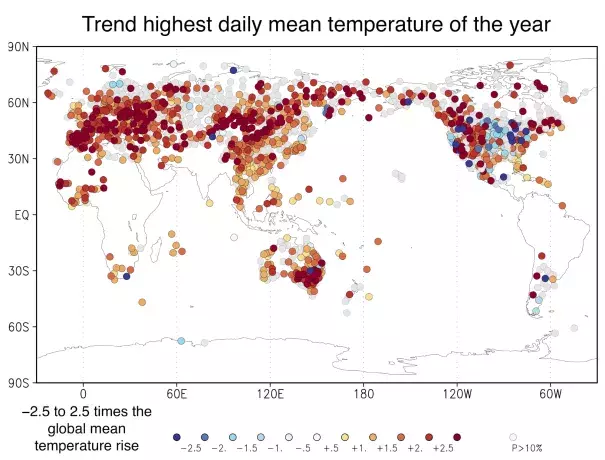
In this analysis a heat extreme is simply defined as the highest daily average temperature of the year. The trend analysis shows that almost everywhere these heat extremes are now warmer than a century ago, following the obvious first-order connection with global average temperature. The authors encountered two exceptions in their work: in the eastern U.S. heat extremes now are roughly as warm as they were during the Dust Bowl of the 1930s, when the severe drought heightened the temperature of hot days. In India, where there has generally been no trend since the 1970s, they find that increasing air pollution and irrigation counteracted the warming trend due to greenhouse gases over that period. In the rest of the world, the increases are typically large, with the temperature of the hottest day of the year rising much faster than the global mean temperatures in most regions (values above one).
The map also shows the sparsity of stations with long daily temperature records that are publicly available in the tropics. This is mainly a result of the data being sold commercially. However, in this region, temperature extremes are also often not acknowledged, although there is evidence that they pose a major health hazard.
