Map: Trend lowest daily mean temperature of the year
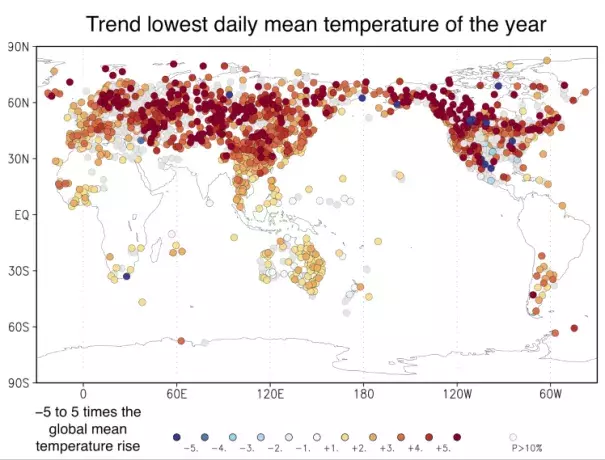
In this analysis, the map shows that cold extremes (defined as the daily average temperature of the coldest day of the year) heat up faster than heat extremes, up to a factor of five times the global mean temperature. The strongest increases over land are in Siberia and Canada. Winter temperatures are very low there due to radiative cooling over snow under a clear sky, with strong vertical gradients in the lowest meters of the atmosphere. These stable boundary layers are sensitive to perturbations, probably also to the extra downward longwave radiation due to greenhouse warming. This may explain the strength of the observed trends. Further south, the cold air from the north is simply less cold, also due to the well-understood Arctic amplification over the Arctic Ocean. Note that the current climate models do not have the resolution to simulate this properly and underestimate the trends.
