Maps: 2-month EDDI categories for July 2018 and 2019 in California
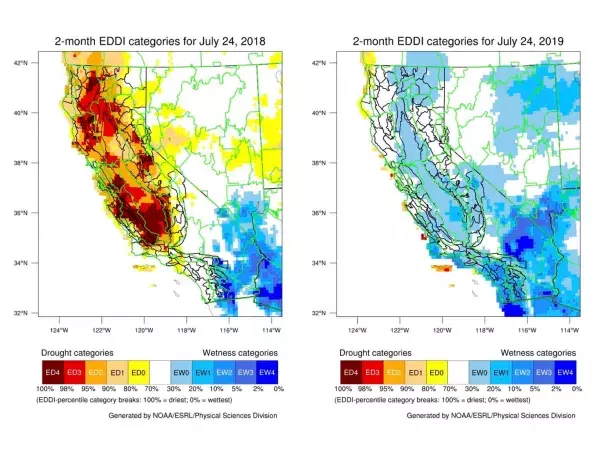
Summer 2019 had a much different start than the previous one, and that can be seen in maps of the Evaporative Demand Drought Index (EDDI) for May through July of the past two years.
EDDI measures the “thirst” of the atmosphere and has shown promise in predicting fire danger. In 2018, the very hot summer dried out vegetation nearly a month ahead of schedule. This summer, with more moderate temperatures and higher daytime and nighttime humidity, plant moisture levels remained near expected values. However, the drying rate seems to be accelerating. “Fuels are starting to really dry out due to the heat,” said Brent Wachter, a predictive services meteorologist for the Northern California region. “We’re seeing shrubs contribute more to fire growth than we were two weeks ago.”
