Maps: Cold and Warm Spell Durations
by Donat, Alexander, Yang et al
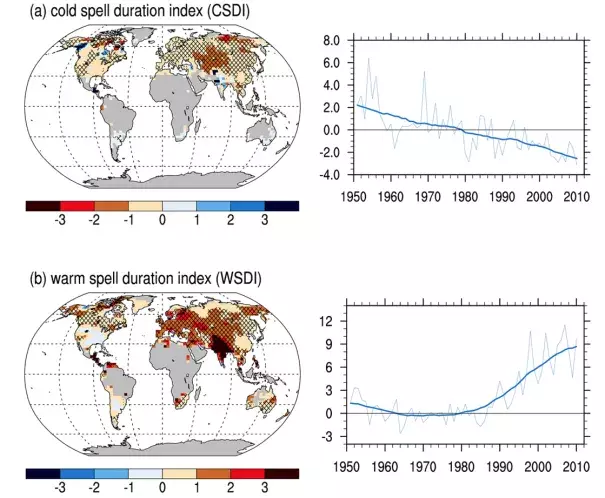
Trends (in annual days per decade) and global average time series for the period 1951–2010 for cold spell duration index (CSDI) and warm spell duration index (WSDI) in HadEX2. Global average time series are shown as anomalies relative to the 1961–1990 average (thin blue line); 21 point Gaussian filtered data (thick blue line) are also shown.[1]
