Maps: Land Surface Temperatures in the SW, June 2017
 acquired June 21, 2017
acquired June 15 - 21, 2017
Hot temperatures are a fact of life in the American Southwest, but the sweltering heat that baked the region in mid-June was anything but routine.
With a large ridge of high pressure lingering over the region, sweltering temperatures neared and, in some cases, surpassed heat records. Power companies faced record demand for electricity. Dozens of flights were grounded. Some people even died because of the heat.
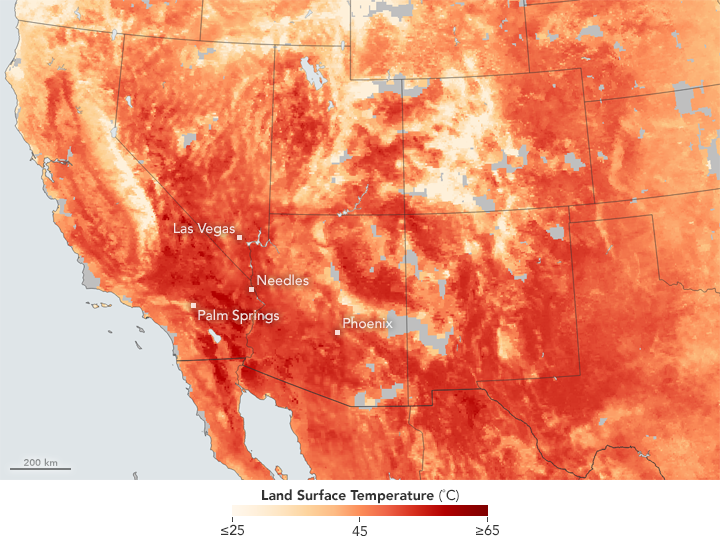
In Phoenix, Arizona, temperatures hit 119 degrees Fahrenheit (48 degrees Celsius). In Palm Springs, California, the high was 122°F degrees. In Las Vegas, Nevada, temperatures peaked at 117°F. Needles, California, tied its all-time high with a temperature of 125°F.
The map at the top of the page shows the heat wave as observed by satellite on June 21, 2017. Note that it depicts land surface temperatures (LSTs), not air temperatures. LSTs reflect how hot the surface of the Earth would feel to the touch in a particular location, and they can sometimes be significantly hotter or cooler than air temperatures. (To learn more about LSTs and air temperatures, read: Where is the Hottest Place on Earth?)
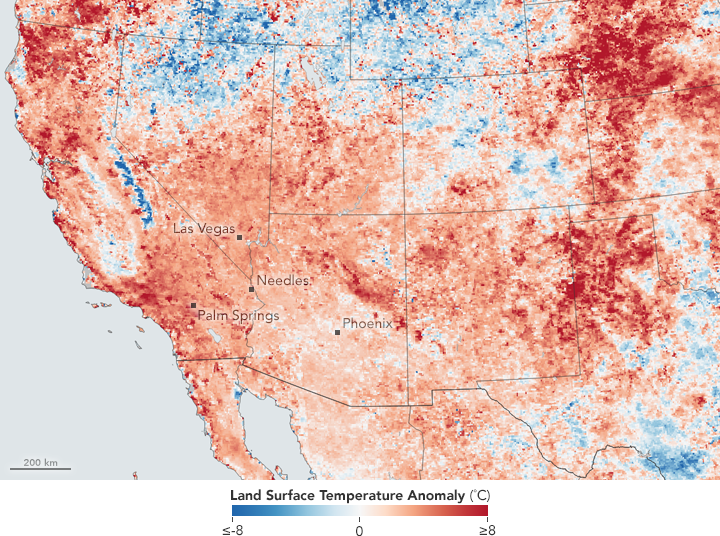
The second map shows land surface temperatures between June 15—21, 2017, compared to average temperatures for the same period from 2001–2010. The anomalies are based on land surface temperatures observed by the Moderate Resolution Imaging Spectroradiometer (MODIS) on NASA’s Aqua satellite. Red areas were hotter than the long-term average, while blue areas were below average. White pixels had normal temperatures, and gray pixels did not have enough data, most likely due to cloud cover.
