Maps: Trends in the magnitude and frequency of flood events
by Iman Mallakpour and Gabriele Villarini
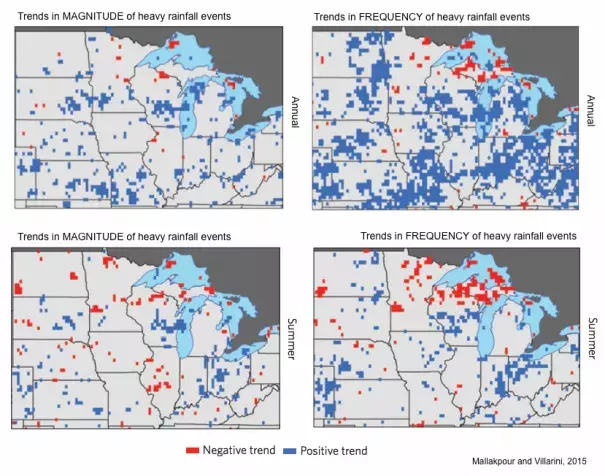
The top two maps show trends in the magnitude and frequency of flood events at the annual scale. The blue (red) triangles indicate the location of the stations with increasing (decreasing) trends at the 5% level. There are 264 (101) stations with increasing trends in frequency (magnitude) and 66 (57) stations with decreasing trends in frequency (magnitude). The grey circles refer to the location of the stations that did not experience statistically significant changes (at the 5% level). These results refer to the common 1962–2011 time period.
The bottom two maps show trends in the magnitude and frequency of flood events.
