Maps: US Timing of Green-up and Last Spring Freeze for 1920-2013
by Peterson and Abatzoglou
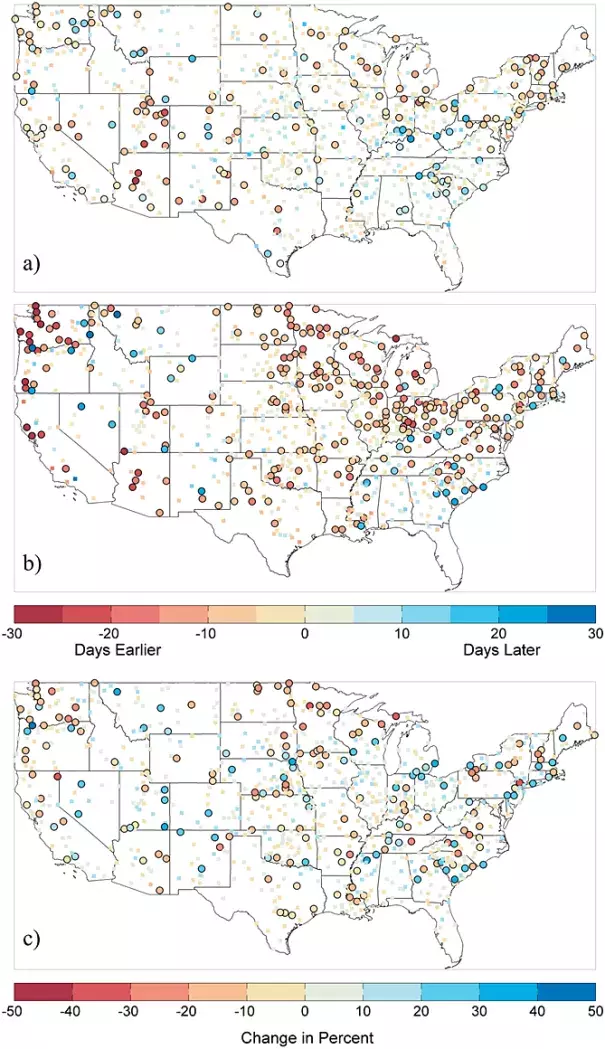
Linear least squares trend in the timing of (a) green-up and (b) last spring freeze for the period 1920–2013. Trend is reported in number days per 94 years, with significant trends represented by larger circles. (c) Change in False Spring Exposure Index between 1920–1966 and 1967–2013. Statistically significant changes are represented by larger circles.
