What Five Years of Drought Have Done to the United States
We’re in the midst of a long, sustained drought that’s been unfolding for the past several years. But just how hard has that drought hit in different parts of the United States? This maps shows exactly.
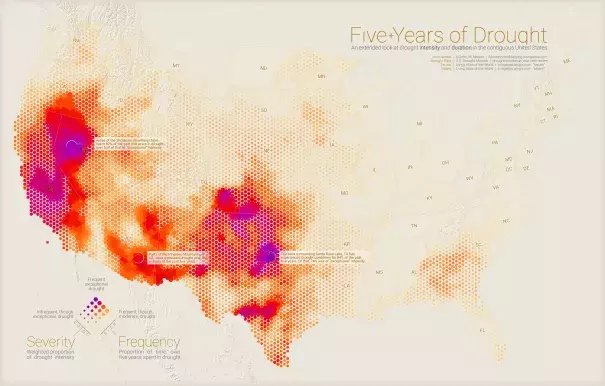
John Nelson over at Adventures in Mapping drew the map using over five years of combined weekly data from the US Drought Monitor. “Visualizing long-term, heavily overlapping data can be a real challenge,” Nelson explained to Gizmodo. “I’ve seen lots of beautiful tools for looking back through historic drought, via interactive maps and timelines. But I was interested in communicating where and how horrible sustained drought is in a single view.”
Seen in one shot like this, it’s easy to see that the drought has, unsurprisingly, hit the lower Pacific Coast and the Southwest the hardest. But the Midwest and lower East Coast are also feeling the dryness of the last five years, both in terms of lack of water and in how long it’s lasted.
