Science Source
Climate Change Indicators in the United States 2016 - Fourth Edition
Summary of Key Points
Greenhouse Gases
- 7 percent—the increase in US greenhouse gas emissions caused by human activities from 1990 to 2014
- 7 percent—the decrease in total US greenhouse gas emissions since 2005
- 35 percent—the increase in worldwide, net emissions of greenhouse gases from human activities from 1990 to 2010
- 42 percent—the increase in carbon dioxide emissions, which account for about three-fourths of total emissions, from 1990 to 2010
- 800,000—the number of years compared to which current current global atmospheric concentrations of carbon dioxide are unprecedented, as shown by historical measurements
- 37 percent—the increase in total warming effect from greenhouse gases added by humans to the Earth’s atmosphere from 1990 to 2015
- 30 percent—the increase in total warming effect associated with carbon dioxide alone from 1990 to 2015
Weather and Climate
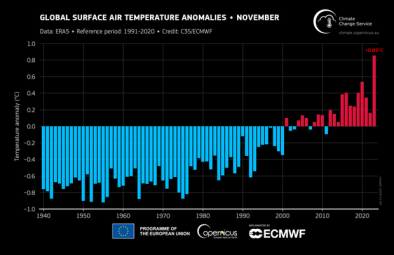
- 10 hottest years occurred between 1998 and 2015
- 0.08 inches—the average rate of increase in precipitation per decade over land areas worldwide since 1901
- 9 out of 10—the number of top years for extreme one-day precipitation events in the US that have occurred since 1990
- 20 to 70 percent—US land area experiencing abnormally dry conditions at any given time from 2000 through 2015
Oceans
- 0.6 inces—the rate at which global sea level has risen per decades since 1880
- 8 inches—the increase in sea level registered along the Mid-Atlantic coast and parts of the Gulf coast between 1960 and 2015
Snow and Ice
- September 2012—when scientists measured the lowest annual minimum Arctic sea ice extent as the melt season for Arctic ice grows
- 24 days—the maximum number of days earlier that thaw dates have shifted among northern lakes in the US over the past 110 years
- 80 percent—the number of locations studied that saw more winter precipitation fall in the form of rain instead of snow in the US since records began in 1930
- 3,300 square miles—the average decrease per year in the portion of North America covered by snow between 1972 and 2015
- Two weeks—the amount of time shorter that snow covers the ground since 1972 in the US
- 90 percent—the proportion of measurement sites showing a decrease in early spring snowpack in the western US between 1955 and 2016
- 23 percent—the average decline in early spring snowpack across all measurement sites in the US between 1955 and 2016
Health and Society
- 9,000—the number of heat-related deaths reported since 1979 in the US
- 28,000—the number of heat-related hospitalizations across 20 states from 2001 to 2010
- 100 percent—the nationwide increase in reported cases of Lyme disease since 1991
- 10 out of 11—the number of studied locations in the central US and Canada that experienced an increase in the length of ragweed pollen season since 1995
Ecosystems
- 9 out of 10—the number of years with the largest acreage burned due to wildfires that have occurred since 2000 in the US, with records going back to 1983
- 5 days—the least number of days earlier that US rivers and streams show peak winter-spring runoff compared to the mid-20th century
- 79 percent—the proportion of measurement sites showing an increase in water temperature in the Chesapeake Bay region from 1960 through 2014
- 1.2°F—the average temperature increase across all Chesapeake Bay stream measurement sites from 1960 through 2014
- 2.2°F—the average temperature increase at stream sites in the Chesapeake Bay where the trend was statistically significant from 1960 through 2014
- 40 miles—the average northward shift of wintering grounds for North American bird species since 1966
- 10 miles—the shift northward along US coasts of the average center of biomass for 105 marine fish and invertebrate species between 1982 and 2015
- 20 feet—the average shift deeper of 105 marine fish and invertebrate species between 1982 and 2015
- 119 miles—the average shift northward of American lobster, black sea bass, and red hake between 1982 and 2015
Related Content
Headline

Feb 15, 2024 | Climate Nexus Hot News
Amazon Could Reach Tipping Point By Midcentury
Headline

Jan 16, 2024 | Climate Nexus Hot News
2023 Smashes Hottest Year Record
Headline
Dec 7, 2023 | Climate Nexus Hot News
It’s Official - 2023 Is World's The Hottest Year On Record
Headline
Dec 7, 2023 | Climate Nexus Hot News
Earth Veering Closer To Dangerous Tipping Points
