Patterns And Projections Of High Tide Flooding Along The U.s. Coastline Using A Common Impact Threshold
- Finds that all official NOAA coastal flood thresholds share a common pattern based upon the local tide range (possibly in response to systematic development ordinances): minor, moderate and major coastal flooding typically begin about 0.5 m, 0.8 m and 1.2 m above a height slightly higher than the multi-year average of the daily highest water levels measured by NOAA tide gauges.
Aims to provide an objective and nationally consistent set of impact thresholds for minor/moderate/major coastal flooding
The primary emphasis is to use the derived threshold for minor flooding, which we refer to as ‘high tide’ flooding (also known as ‘nuisance’, ‘sunny day’ and ‘recurrent tidal’ flooding), to assess nationally how exposure—and potential vulnerability—to high tide flooding has and will continue to change with changing sea levels
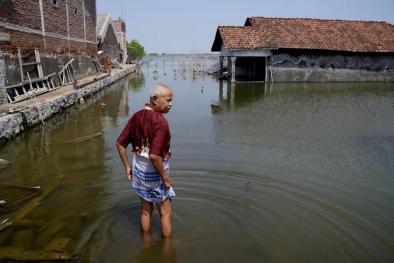
States that, due to rising relative sea level (RSL), more and more cities are becoming increasingly exposed and evermore vulnerable to high tide flooding, which is rapidly increasing in frequency, depth and extent along many U.S. coastlines
States that today, high tide flooding is likely more disruptive (a nuisance) than damaging, but the cumulative effects are becoming a serious problem in several locations including many with strategic importance to national security such as Norfolk, Virginia, San Diego, California and Kwajalein Island in the U.S. Marshall Islands
Finds that annual frequencies of high tide flooding over the last several decades are linearly increasing in 31 locations (out of 99 tide gauges examined outside Alaska) mostly along the coasts of the Northeast/Southeast Atlantic and the Eastern/Western Gulf of Mexico, and to a lesser extent, along the Northwest and Southwest Pacific coasts
Finds that annual frequencies are accelerating (nonlinearly increasing) in 30 locations mostly along the Northeast and Southeast Atlantic Coasts
Finds that high tide flood frequencies are increasing at the highest overall rates (and likely becoming most problematic) along the coasts of the Southeast Atlantic and to a lesser extent along the Northeast Atlantic and the Western Gulf
Finds that between 2000 and 2015, annual frequencies increased (median values) by about 125% (from 1.3 days to 3.0 days/year) along the Southeast Atlantic, by 75% (from 3.4 days to 6.0 days/year) along the Northeast Atlantic and by 75% (from 1.4 days to 2.5 days/year) along the Western Gulf
States that flood frequencies are relatively high during September–April along the Northeast Atlantic Coast and generally peak in October–November, while along the Southeast Atlantic and Gulf Coasts, frequencies are highest during September–November with a secondary peak in June–July
States that during the El Niño phase, high tide flood frequencies are amplified at 49 (about half of examined) locations along the U.S. West and East Coasts beyond underlying RSL rise-forced trend increases
States that with continued RSL rise, high tide flood frequencies will continue to rapidly increase and more so simply from tidal forcing, which today is very rare
Assesses future changes locally projected under a subset of the global rise scenarios of the U.S. Federal Interagency Sea Level Rise and Coastal Flood Hazard Task Force, specifically the Intermediate Low (0.5 m global rise by 2100) and Intermediate (1.0 m global rise) scenarios
Finds that under these two scenarios, by 2050, annual high tide flood frequencies along the Western Gulf (80 and 185 days/year, respectively) and Northeast Atlantic (45 and 130 days/year) are higher largely because RSL rise is projected to be higher
Finds that, on average across all regions, high tide flooding by 2050 will occur about 35% and 60% of the times solely from tidal forcing under the Intermediate Low and Intermediate Scenarios, respectively
By 2100, high tide flooding will occur ‘every other day’ (182 days/year) or more often under the Intermediate Low Scenario within the Northeast and Southeast Atlantic, the Eastern and Western Gulf, and the Pacific Islands with tidal forcing causing all (100%) of the floods except within the Eastern Gulf (80% caused by tides)
States that, by definition, ‘every other day’ high tide flooding would bring to fruition the saying championed by NOAA’s (late) Margaret Davidson: “Today’s flood will become tomorrow’s high tide"
Finds, under the Intermediate Scenario, that high tide flooding will become ‘daily’ flooding (365 days/year with high tide flooding) within nearly all regions with tide forcing alone, causing 100% of flooding
Lastly, these results illustrate how close U.S. coastal cities are to a tipping point with respect to flood frequency, as only 0.3m to 0.7 m separates infrequent damaging-to-destructive flooding from a regime of high tide flooding—or minor floods from moderate and major floods
Related Content