Science Source
A Revised U.S. Climate Extremes Index
- Presents a revised framework that quantifies observed changes in the climate of the contiguous United States through analysis of a revised version of the U.S. Climate Extremes Index (CEI)
- States that CEI is based on a set of climate extremes indicators that measure the fraction of the area of the United States experiencing extremes in monthly mean surface temperature, daily precipitation, and drought (or moisture surplus)
- The revised CEI incorporates auxiliary station data, including recently digitized pre-1948 data to extend further back in time and to improve spatial coverage
- Finds that observations over the past decade continue to support the finding that the area experiencing much above-normal maximum and minimum temperatures in recent years has been on the rise, with infrequent occurrence of much below- normal mean maximum and minimum temperatures
- Finds, conversely, that extremes in much below-normal mean maximum and minimum temperatures indicate a decline from about 1910 to 1930
- Observes an increasing trend in the area experiencing much above-normal proportion of heavy daily precipitation from about 1950 to the present
- Identifies a period with a much greater-than-normal number of days without precipitation from about 1910 to the mid-1930s
- Finds that warm extremes in mean maximum and minimum temperature observed during the summer and warm seasons show a more pronounced increasing trend since the mid-1970s
- Results from the winter season show large variability in extremes and little evidence of a trend
- The cold season CEI indicates an increase in extremes since the early 1970s yet has large multidecadal variability
Related Content
Headline

Nov 18, 2021 | Climate Nexus Hot News
Number Of Hot Summer Days That Fuel Wildfire Spread Will Rise
Science Source
| Geophysical Research Letters
Evaluating the performance of past climate model projections
Zeke Hausfather, Henri F. Drake, Tristan Abbott et al
Headline
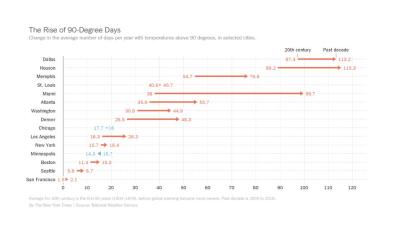
Jul 24, 2019 | New York Times
Boston Has Become New York
Headline
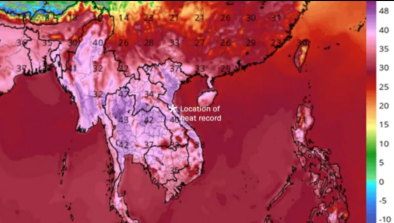
Apr 23, 2019 | Washington Post
Vietnam just observed its highest temperature ever recorded: 110 degrees, in April
