Science Source
Rising heat wave trends in large US cities
- Examines changes in four heat wave characteristics from 1961 to 2010 to understand how heat waves are changing over time
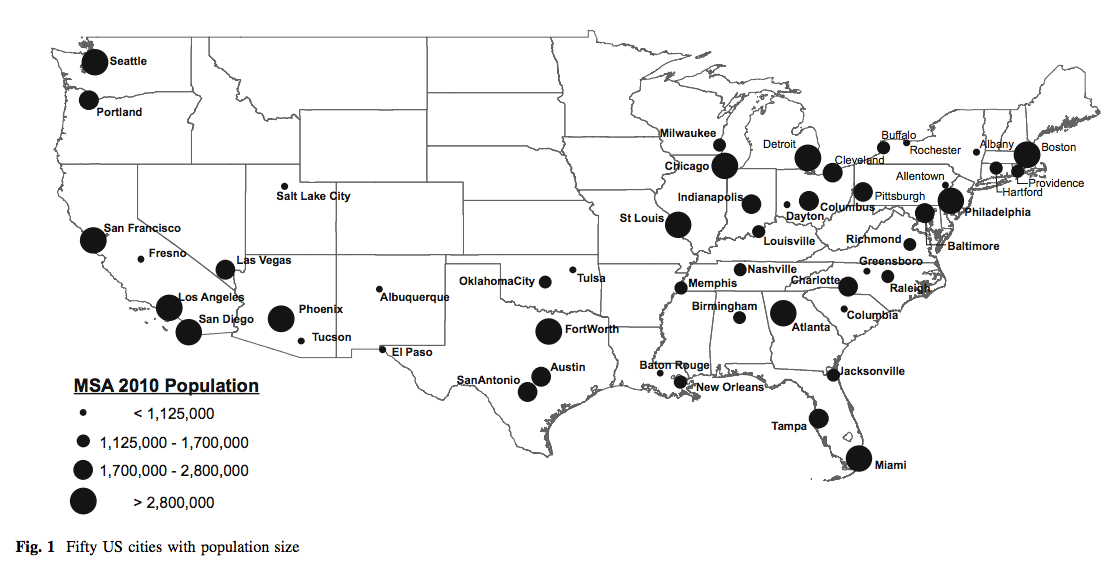
- Examines frequency, duration, intensity, and timing, in 50 large US cities
- Assesses the extent to which urban populations are increasingly exposed to heat-related health hazards resulting from changing trends in extreme heat
- Finds each of these heat wave characteristics to be rising significantly when measured over a five-decade period, with the annual number of heat waves increasing by 0.6 heat waves per decade for the average US city
- Finds the length of heat waves to be increasing by a fifth of a day, the intensity to be increasing 0.1 °C above local thresholds, and the length of the heat wave season (time between first and last heat wave) to be increasing by 6 days per decade
- Concludes that the regions most at risk due to increasing heat wave trends must plan appropriately to manage this growing threat by enhancing emergency preparedness plans and minimizing the urban heat island effect

Related Content
Headline

Sep 24, 2017 | KMSP
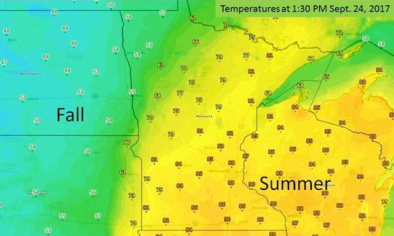
Late September heat wave breaks Twin Cities records
Headline

Sep 24, 2017 | Chicago Tribune
Chicago heat wave sets record high for 5th day in row
Science Source
| Proceedings of the National Academy of Sciences
Quantifying the influence of global warming on unprecedented extreme climate events
Noah S. Diffenbaugh, Deepti Singh, Justin S. Mankin et al
Real Time Data

Jul 15, 2016 | NOAA / NCDC
US Daily Temperature and Precipitation Summaries


