Science Source
Trends in heat-related mortality in the United States, 1975-2004
- Addresses the long-term trends in heat-related mortality across 29 US metropolitan areas from 1975 to 2004 to discern the spatial patterns and temporal trends in heat vulnerability
- Standardizes mortality data to account for population trends, and seasonal and interannual variability
- Calculates mean anomalous mortality along with the likelihood that oppressive days led to a mortality response at least one standard deviation above the baseline value, on days when a city experienced an "oppressive" air mass
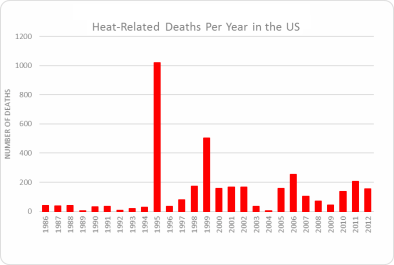
- Results show a general decline in heat-related mortality from the 1970s to 1990s, after which the decline seems to have abated
- Finds that the likelihood of oppressive days leading to significant increases in mortality has shown less of a decline
- Finds the number of oppressive days has stayed the same or increased at most metropolitan areas
- Concludes that with US homes near saturation in terms of air-conditioning availability, an aging population is still significantly vulnerable to heat events
Related Content
Headline
Apr 1, 2016 | Illinois State Climatologist Office
Heat-Related Deaths in the US
Science Source
| Annals of Internal Medicine
Near-Fatal Heat Stroke during the 1995 Heat Wave in Chicago
Jane E. Dematte, Karen O'Mara, Jennifer Buescher et al
Headline

Apr 1, 2016 | Chicago Magazine
How 739 People Died in a Chicago Heat Wave
Science Source
| PubMed - NCBI
Heat waves in the United States: mortality risk during heat waves and effect modification by heat wave characteristics in 43 U.S. communities
Anderson GB and Bell ML
