US Phenology Observations
USA National Phenology Network
Related Content
Real Time Data
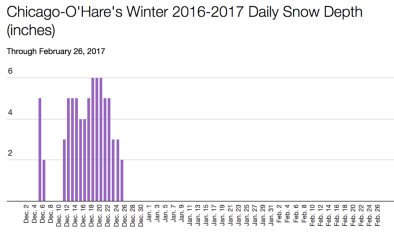
Feb 28, 2017 | NOAA/NWS-Romeoville, IL
Chicago Snow Depth
Headline
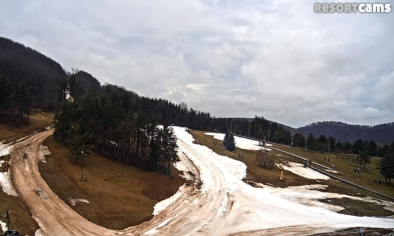
Feb 28, 2017 | Washington Post
Mid-Atlantic ski resorts hurting because of lack of winter; Wisp closes weeks early
Headline
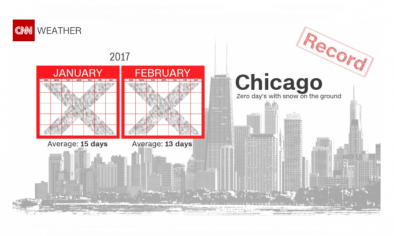
Feb 28, 2017 | CNN
Where is the snow?
Science Source
| American Meteorological Society
Changing Northern Hemisphere Snow Seasons
Gwangyong Choi, David A. Robinson, and Sinkyu Kang
