California Water Year 2016-2017
From November 2016 onward, California experienced several months of unremitting precipitation, including numerous atmospheric rivers and storms that brought heavy precipitation. While no one storm was notably extreme compared to California's historical records, it all added up to one of California's wettest seasons on record. One important indicator of California water supply, however, has lagged behind precipitation: snow pack, which supplies 1/3rd of the state's water supply.
While winter precipitation came in near record levels, snow pack did not. Overall precipitation in the Northern Sierras came in at 200 percent of average,[2] yet snow pack was only at 148 percent of average on April 1, 2017.[1] Warming temperatures convert snowfall to rainfall and enhance snow melt, both of which, in turn, can reduce snow pack.
California's 2016-2017 winter was significantly warmer than average, contributing to the gap between snow pack and overall precipitation, consistent with the long-term trend in California driven by climate change. 68 percent of California weather stations located between 2,000 and 5,000 feet have experienced declines in the ratio of snow to total winter precipitation from 1949-2004.[3] October through December 2016 were very wet months in northern California (with precipitation totals about 170 percent of normal by 1 January 2017), but because several of the storms were warm rainfall, snow pack in California by 1 January was only 64 percent of normal.
During March 2017 the average minimum temperature in the Sierra Nevada mountains was 3 to 4°F above the 1949-2005 average, increasing the forcing of snow melt.
Climate science at a glance
- California depends upon snow pack for roughly one third of its water supply.
- Warming temperatures are shifting snowfall to rainfall and driving a more pronounced and earlier snow melt, increasing the length of the dry low-runoff period and potentially reducing surface soil moisture.
- California dams, many of which are managed to provide both water storage and flood control, are increasingly challenged as the run-off season increasingly overlaps with the wet season. The demand for water storage calls for capturing as much run-off as possible, yet the demand for flood control calls for maintaining reduced reservoir levels behind dams, making it difficult to capture early run-off during the wet season.
- Despite record seasonal precipitation during the winter of 2016-2017, snow pack is lagging behind overall precipitation. The decreasing ratio of snow pack to overall precipitation is an indicator of the temperature-driven snow-melt signal in western US snow pack and California.
- Global warming is increasing the strain on water supplies in California through rising temperature, even in wet years.
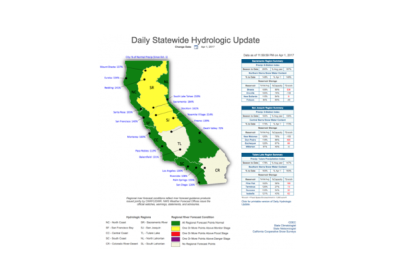
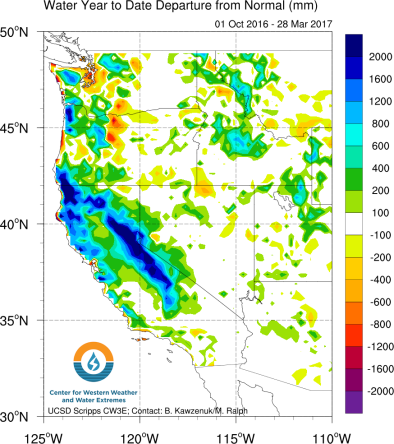
Precipitation for virtually all of California is running well above average...
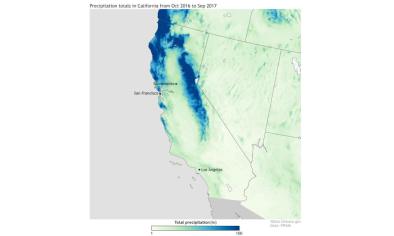
 California's year-to-date precipitation is nearly the wettest on record (the Water Year runs from October 1 through September 30). On April 1, 2017, the state had received 144.3 percent of its average annual precipitation accumulation, 9 points shy of 1983's record for the date of 153.3.
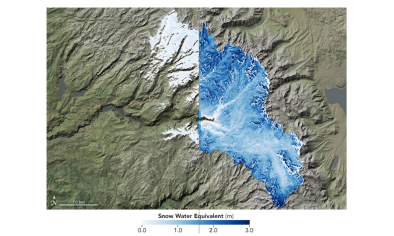
Virtually every corner of the state is above average to date, though anomalies have been much more impressive in the north (see image to the right). If California receives at least average precipitation for the rest of the season, 2016-2017 will become the state’s wettest Water Year on record.[1]
...but snow pack is lagging behind
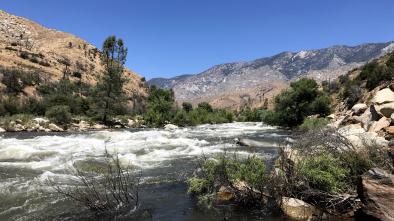
Mountain areas where precipitation collects and drains off, known as catchments, are key sources for river water and water supply. In the western US, they contribute as much as 75 percent of surface-water and groundwater supplies.
Snow pack in California’s mountains is also well above average and the highest since 2010-2011.[1] However, snow water equivalent—the amount of water contained within the snowpack—has lagged overall precipitation. The difference is due to above normal temperatures in most of California and high storm snow levels.[2] Scientists have named this phenomena "warm snow drought," a term intended to distinguish reductions in water resources due to warmer temperatures, which reduce snow pack, from those driven by absolute decreases in precipitation ("dry snow drought").[3]
October through December 2016 were very wet months in northern California (with precipitation totals about 170% of normal by 1 January 2017), but because several of the storms were warm rainfall, snow pack in California by 1 January was only 64% of normal.[3]
During March 2017, average minimum temperature in the Sierra Nevada mountains was 3 to 4°F above the 1949-2005 average, increasing the forcing of snow melt.[4]
Here is a table listing precipitation versus snow water equivalent totals for California's major hydrological regions, on April 1, 2017:
|
Hydrologic Region |
Total Precipitation (% average); inches (in) |
Snow Water Equivalent (% average); inches (in) |
| Northern Sierra (Sacramento River) | 200; 83.4 | 148; 41.5 |
| Central Sierra (San Joaquin) | 193; 64.9 | 173; 50.0 |
| Southern Sierra (Tulare Lake) | 178; 43.6 | 163; 43.6 |
| Statewide | 190; 64.0 | 163; 45.7 |
Total precipitation and snow water equivalent (SWE) are well above average for all three regions, yet SWE is lagging behind precipitation. Source: CNRFC/DWR
"Warm snow drought" — how warmer temperatures increase the rain-to-snow ratio
Temperature and precipitation both affect water supplies. Rising temperatures have a larger effect at locations and elevations near the freezing level where small changes in temperature can determine whether snow packs melt and whether precipitation falls as rain or snow. Changes in precipitation become more important at in colder locations and higher elevations where they determine whether any or how much precipitation falls.[5]
With incremental warming, significant fractions of snowfall events shift to rainfall events.[6] Across California, 68 percent of weather station located between 2,000 and 5,000 feet registered a lower percentage of winter precipitation falling as snow, according to 65 years of winter precipitation data.[7]
Because winter temperatures in the Sierra Nevada mountains are often near the thawing threshold, a small difference in the temperature of passing weather systems often determines whether precipitation falls as snow or rain.[8] Rain-on-snow-producing atmospheric river storms are, on average, only 2°C warmer than others storm types that preserve snow pack.[8] Weather systems passing through California originate globally, and the average global increase in temperature has been 1°C, indicating significant risk that storms arriving in California may be warming and converting additional snow pack to mountain run-off.
While the warming signal during the winter of 2017 was hidden under a relatively large snow pack due to near-record precipitation, the warming signal stood out starkly in the record-low snow pack of 2015 when the snow pack virtually disappeared. Sierra Nevada snow pack stood at its lowest level in at least 500 years despite precipitation levels that, while low, still came in significantly above record lows. The difference was due to much-warmer-than-usual temperatures and the fingerprint of global warming contributing to those temperatures has been formally identified.[9] [10]
The ratio of snow pack (measured in snow water equivalent) to overall precipitation (SWE/P) is an indicator of a temperature-driven snow-melt signal on western US snow pack.[5] The SWE/P ratio shows what fraction of current water year precipitation remains in the snow pack for any given day of the water year: the closer SWE (snow water equivalent) is to P (overall precipitation), the more water resources remain.[5]
Long-term climate warming is strongly correlated with declining snow water equivalent and shifts in stream flow throughout the American West and appear to be largely explained by decreased spring accumulation and/or increased spring melt.[6] At broad scales the fingerprint of anthropogenic warming contributing to these shifts has been formally identified.[9][5][11][12]
Winter temperature
During California's 2016-2017 winter the average temperature for December through February was a significant 0.8°F (0.4°C) above the 20th century average (see image below), and temperatures have been considerably warmer than the temperatures recorded during most of California’s past exceptionally wet winters.[1]
In 2015, for the first time in 120 years of record keeping, the winter average minimum temperature in the Sierra Nevada was above freezing, a key threshold for maintaining snow pack.[13]
March temperature and precipitation
Statewide temperatures in March were above average. Precipitation in the Northern Sierra dropped to average and precipitation in the San Joaquin and Tulare hydrological regions was significantly below average.[14]
Minimum temperatures play an especially important role in March, when the average overnight low temperatures in high elevations hover around the freezing point. Warmer minimum temperatures can lead to more rapid snow melt when overnight temperatures rise above the melting point. In March 2017, temperatures in the Sierra Nevada mountain range were 3 to 4°F above the 1949-2005 average (see image below on the left)[4] and contributed to reduced snow pack levels.[2]
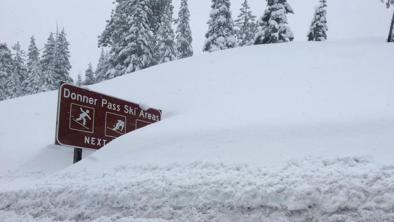
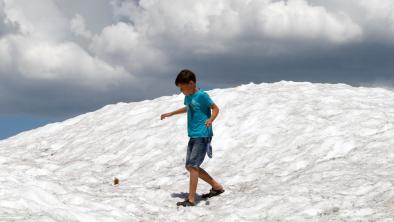
In 2016-2017, snow pack began to level off in March (see image below on the right). For comparison, snow pack in 1982-1983, perhaps the most comparable year, did not level off and decline until May.


Trends and forecasts
A 2015 study found that warm conditions induced by human-caused global warming have already increased the risk of severe drought in California, even in the absence of trends in precipitation.[15]
As a result, the peaks in California’s snow melt and surface runoff are likely to be more pronounced and to occur earlier in the calendar year, increasing the duration of the warm-season low-runoff period and potentially reducing surface soil moisture.[16][17]
A 2013 study modeled climate and water system (hydroclimate) changes in the Western US over the next three decades and found that increased temperature is the dominant factor, likely leading to several hydroclimate changes, including: decreases in spring snow pack, increases in cold-season days above freezing, and decreases in the cold-season snow-to-precipitation ratio.[18] The models also found consistent trends indicating a decrease in April 1 snow water equivalent.[18] These changes can result in shifts toward earlier snow melt, base flow, and runoff dates throughout the region, as well as reduced annual and warm-season snow melt and runoff.[18]
Related Content