June 2017 ENSO update: pancake breakfast
One of the key ways we measure ENSO uses the temperature anomaly in the central tropical Pacific, meaning the difference from the long-term average. So, for example, the 2015-16 El Niño peaked during November–January, when the seasonal Oceanic Niño Index was 2.3°C (around 4°F) above average. But what exactly is average? Like most things having to do with weather & climate, it’s not so simple.
“Average” for the Oceanic Niño Index is based on the most recent 30-year period, updated every 5 years. So right now in 2017, “average” is defined by the 1986-2015 period. Meaning, to get the March–May 2017 Oceanic Niño Index, we would first calculate the average sea surface temperature during March–May over the 30 years from 1986-2015: 27.7°C (81.9°F). Then we’d subtract that from the March–May 2017 temperature, which was 28.1°C (82.6°F), yielding an anomaly of 0.4°C (0.7°F).
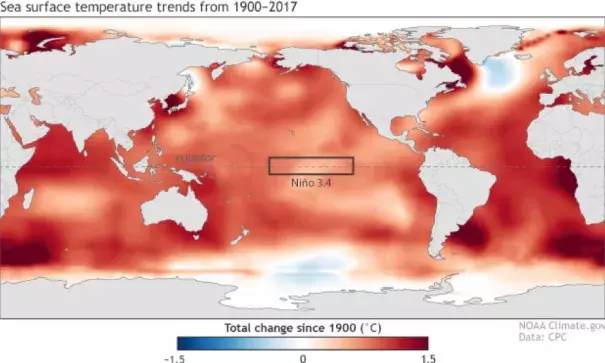
In 2021, the average period will be updated to 1991-2020. We update this 30-year period every five years because the temperature in the central Pacific, just like most of the rest of the world, has been increasing due to human-caused climate change. (Some resources on climate change: climate.gov, NOAA, NASA, IPCC.)
The temperature in the Niño3.4 region hasn’t warmed quite as fast as much of the rest of the planet, but still has increased around 0.5-0.75°C (0.9 – 1.35°F) since the beginning of the previous century. The warming trend over the past 50 or so years is even steeper than that starting in 1900.
By updating our reference for comparison, we can remove most of the warming trend from the temperatures. If we used only one base period (for example, 1971-2000) from when the ocean was cooler overall, the trend would more clearly affect our ability to reach El Niño and La Niña thresholds (in effect, leaving the trend in would make it easier to achieve El Niño and harder to achieve La Niña). There’s more information about this method of trend removal here.
This trend in SSTs poses a problem because there’s a lot more to ENSO than just the temperature of the Nino3.4 region. For example, the temperature gradient (change with distance) across the tropical Pacific is critical to driving the system. ENSO also requires changes in the atmosphere, and there are no associated trends in the Southern Oscillation Index, for example. Identifying a way to distinguish the strength and variability of ENSO events in a warming world is an active area of research by some of the top climate scientists.
Related Content