Houston Precipitation
Climate Prediction Center
In the time series, the thick line depicts the accumulated actual precipitation and the dashed, thin line shows the accumulated normal precipitation. Regions shaded green show precipitation surpluses; regions shaded brown show precipitation deficits.
For other locations in the region, click here.
Related Content
Headline
Jun 6, 2016 | CNN
5 Fort Hood soldiers dead, 4 missing amid Texas flooding
Headline
Jun 5, 2016 | The Weather Channel
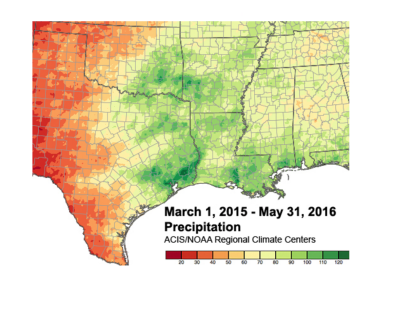
Over 100 Inches of Rain Have Soaked Parts of the South Since Spring 2015
Headline
Jun 5, 2016 | Weather Wunderground
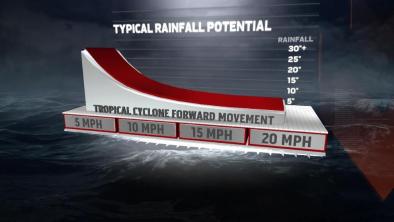
Tropical Storms Can Be Devastating and Deadly
Headline

Jun 5, 2016 | The Weather Channel
16 Killed, 1 Missing in Plains Flooding; Fort Hood Soldiers Identified
