Western US Extreme Heat June 2019
Extreme heat is among the most obvious and well documented effects of climate change.
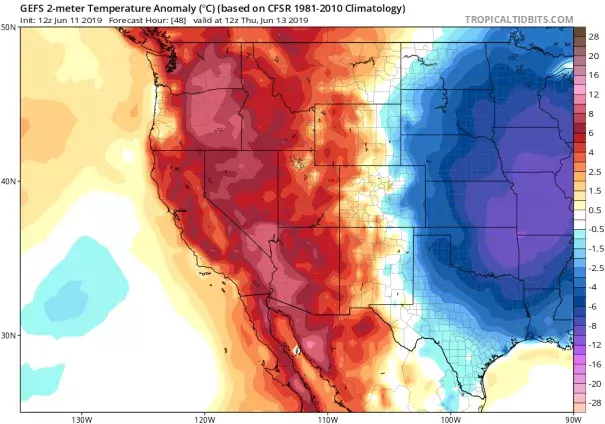
In mid-June, heat advisories and warnings went into effect for a number of major metro areas; including Las Vegas, Phoenix, Portland, Sacramento and San Francisco. On June 10 in San Francisco, the high temperature was 31°F hotter than average and the record high for the date was shattered by 9°F.
In the Southwest, this is the fourth year in a row the region has endured life-threatening temperatures during the warm season before the southwestern monsoon arrives.
Climate change impacts don’t get any clearer than this. Due to global warming, extreme and record-breaking heat events like this have become commonplace.


Climate science at a glance
- Extreme heat is among the most obvious and well documented effects of climate change.
- The signal of climate change is especially clear in the western United States where a formal attribution study has made the link.[1]
- In the US, western regions set the most records for the number of heat wave events in the 2000s.[2]
- Four out of five record-hot days globally are now amplified by the trend in global warming.[1]
- The early arrival of summer heat during spring is another signature of climate change known as season creep.
Background: high pressure systems
When a high pressure system develops in the upper atmosphere, the air below it sinks and compresses because there is more weight on top. This causes temperatures in the lower atmosphere to heat up. High pressure also pushes the jet stream and its drier, cooler air, farther north.
Climate Signals breakdown
Climate Signal #1: Extreme heat and heat waves
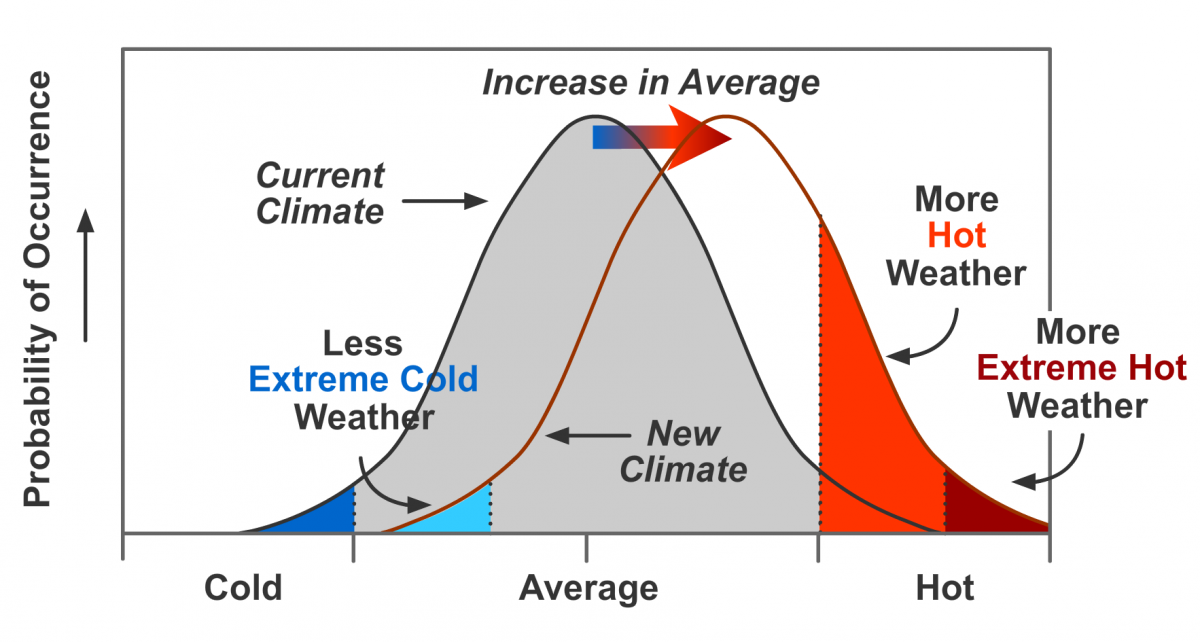 Record breaking temperatures are a classic signal of climate change. As the average global temperature rises and the climate shifts, hot temperatures that were extreme under the old climate are closer to the middle of the new temperature range.[3] Under the earth's climate system, events closer to the midpoint of the climate range occur much more frequently than events closer to the extremes, as shown in the graphic on the right. The shifting bell curve also leads to the occurrence of never-before-seen extremes in high temperatures.[4]
Observations consistent with climate signal #1
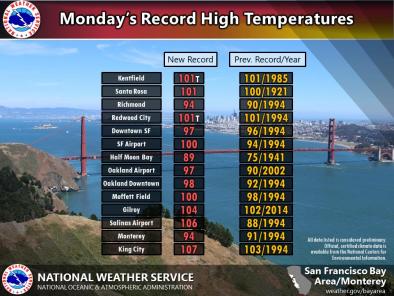
- San Francisco tied its daily record high of 91°F on June 9, then set a new daily record high on June 10, with a high of 97°F.[5] This shattered the previous record of 88 set in 1985. The normal high temperature in the city on June 10 is 66 degrees, officials said.[5]
- Monterey, California, set a new all-time record high for meteorological summer (June-August) on June 10, when it topped out at 97°F at the airport. This also smashed the daily record high for June 10, which was only 77 degrees.[7]
Climate Signal #2: Atmospheric blocking increase
The fingerprint of anthropogenic climate change has been identified in the temperature pattern favoring planetary wave stalling.[6] Planetary waves are a pattern of winds, of which the jet stream is a part, that encircle the northern hemisphere in lines that move from the tropics to the poles. Normally, the whole wave moves eastwards but, under certain temperature conditions, the wave can halt its movement. This leaves whole regions under the same weather for extended periods, which can turn hot spells into heatwaves and wet weather into floods.[6]
Studies have shown that the strength of these persistent weather patterns has trended upward in recent decades. One analysis identifies an increase in the intensity of persistent high pressure areas over the entire Northern Hemisphere during the summer months from 1979 to 2010.[4]
Observations consistent with climate signal #2
- On June 10, the jet stream amplified, taking a pronounced southward plunge east of the Rockies and building northward in the West. The jet stream typically runs in a flatter west-to-east fashion near the Canadian border during the summer months.[7]