
Air Mass Temperature Increase
Air temperature and the amount of moisture the air can hold increase alongside global temperature. Warm and moist air are necessary for providing the energy to storms, and there is evidence for a global increase in severe thunderstorm conditions.[1]
Read More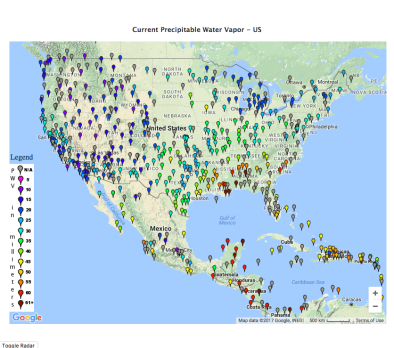
Climate science at a glance
- Humans are the primary external influence on air temperature.
- Warmer air can hold more water increasing the risk of extreme precipitation events.
Background information
Global warming affects the interaction between the air and ocean
The air and ocean are two major vessels of heat energy and moisture in the climate system. The exchange of heat and moisture between the air and the ocean affects circulation patterns that determine the weather we experience.
The ocean is storing 93 percent of the extra heat due to human-caused global warming, which has many consequences on the climate system as a whole.[1] One of these consequences has to do with the exchange of heat and water between the ocean and the atmosphere.
As sea surface temperatures warm, the hydrological cycle intensifies and additional heat is available for pick-up by air masses passing over the ocean and onto land. The additional heat in air masses can then affect extreme weather events.
Clausius-Clapeyron: the capacity of the air to hold moisture increases with temperature
As the temperature of the air increases, its water-holding capacity also increases by about 7 percent per °C of warming globally, according to the Clausius-Clapeyron relationship.[1] Consequently, precipitation in the form of rain and snowfall also increases with air temperature.
Changes in extreme precipitation from fully saturated air masses have been postulated to occur at the Clausius-Clapeyron rate, or even higher if local moisture convergence takes place, but changes in precipitation over the Earth's surface are typically smaller (approximately 2 to 3 percent per °C of warming[2]) than the Clausisus-Clapeyron rate, due to a difference in behavior over land and ocean.[3]
Global air mass temperature trends and climate change
- Global annually averaged surface air temperature has increased by about 1.8°F (1.0°C) over the last 115 years (1901–2016).[4]
- Annual average near-surface air temperatures across Alaska and the Arctic have increased over the last 50 years at a rate more than twice as fast as the global average temperature.[4][5]
- Warm and moist air are necessary for providing the energy to storms, and there is evidence for a global increase in severe thunderstorm conditions.[6]
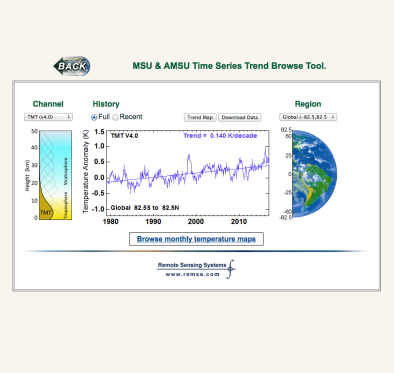
- The troposphere — the lowest region of the atmosphere — has warmed and the stratosphere — the second major atmospheric layer above the troposphere — cooled since 1958. Uncertainty regarding atmospheric temperature change grows with height and is much greater outside the better-sampled Northern Hemisphere extra-tropics, where warming is of the order 0.1°C per decade.[1]
Global studies attribute air mass temperature increases to climate change
- (Wehner et al. 2018): The shift in the distribution of surface air temperature since the mid 20th century has been profound. Temperatures that were rare prior to the 1980's now occur with regularity.[7]
- (Santer et al. 2012) find that over the past century, humans are the primary external influence on atmospheric temperature.[8]
- (Balan et al. 2012) find that clear global‐scale and regional‐scale changes due to human influence are expected to have occurred over both land and ocean, which includes moistening over northern high latitude land and ocean throughout all seasons and over the northern subtropical oceans during boreal winter.[9]