Snowpack Decline
Global warming affects snow and ice cover by increasing the amount of precipitation falling as rain instead of snow and by hastening snowmelt. Scientists have already observed these trends in the Western US. Atmospheric circulation may also be leading to an overall decrease in the amount of precipitation.
Read More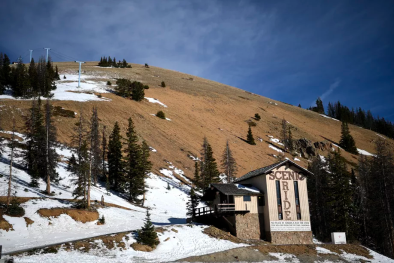
Global snowpack decline trends
Snow and ice cover have diminished globally, and Northern Hemisphere spring snowpack decline cover is particularly noticeable. Scientists agree, human-caused global warming is the dominant cause.[1]
Northern Hemisphere snow cover extent decreased 1.6 percent per decade for March and April, and 11.7 percent per decade for June, over the 1967 to 2012 period.[1] The area of Northern Hemisphere spring snow cover is projected to decrease by 7 to 25 percent by the end of the 21st century, depending on the level of future emissions reductions.[1]
California snowpack decline trends
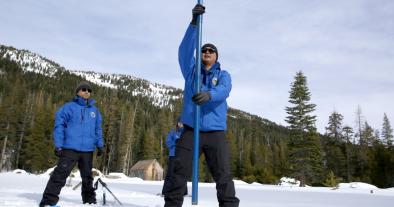
California has experienced climate change-amplified loss of snowpack due to higher temperatures that are accelerating spring melt and increasing the amount of precipitation falling as rain instead of snow.[2]
During the 2014-2015 water season—and for the first time in 120 years of record keeping—the winter average minimum temperature in the Sierra Nevada was above freezing, helping to explain the season’s record-low snowpack.[3] At Donner Summit in the Sierras, end-of-season snowpack on April 1, 2015 was the lowest on record, at only 0.51 inches (1.3 cm), or less than 2 percent of the long-term average.[4]
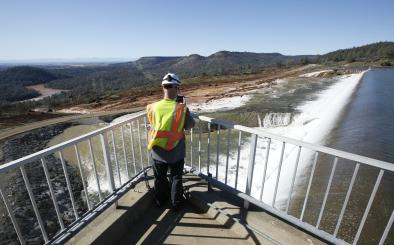
California’s diminished and faster-melting snowpack amplifies drought by lowering streamflow later in the spring and summer. The melting snow accounts for much of the seasonal water supply. In normal years, snowpack provides about a third of the state’s total water supply.[5] The greater the spring snowpack water content, the greater the likelihood California’s reservoirs and rivers will receive ample late spring and early summer runoff as the snowpack melts to meet the state’s water demand in the summer and fall.