
Intense Northwest Pacific Typhoon Frequency Increase
As the ocean warms, surface waters have more energy to convert to hurricane winds, which scientists say is likely increasing the intensity of the strongest storms. The fingerprint of global warming in the intensity of tropical cyclones has been identified in the Northwest Pacific basin.[1]
Read More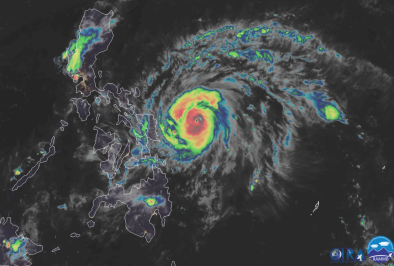
Climate science at a glance
- The fingerprint of global warming has been identified in the accumulated cyclone energy (ACE) in 2015 in the Northwest Pacific.[1]
- There has been a global increase in the observed intensity of the strongest storms.[2]
- Tropical cyclones are fueled by available heat. Warming seas are increasing the potential energy available to passing storms, which increases the power ceiling or speed limit for these cyclones.[3]
- Higher sea surface temperatures are associated with more rapid hurricane intensification.[4]
Background information
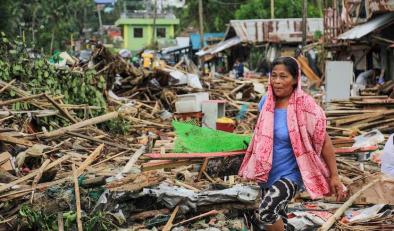
Climate change is supercharging tropical cyclones and exacerbating the risk of major damage in three ways
There are three primary ways that human-caused climate change affects the activity of tropical cyclones. In addition to raising the potential energy available to passing storms, climate change causes sea level rise, which leads to higher storm surge — the main driver of damage for coastal regions[5] — and increases extreme precipitation.
Trends that suggest an increase in the frequency of intense Northwest Pacific Typhoons
A number of studies have identified increasing trends in intense typhoon frequencies in the Northwest Pacific.[6][7][8][9][10]
A 2016 study documented the tight connection between increasing ocean warmth and the increasing intensity of typhoons in the western North Pacific, finding that "the energy needed for deep convection is on the rise with greater heat and moisture in the lower tropical troposphere," and that as a result, super typhoons in the region are, "likely to be stronger at the expense of overall tropical cyclone occurrences."[6]
However, other recent modeling work projects an increase in both the frequency and intensity of typhoons in the western North Pacific.[11]
Satellite-based intensity trends since 1981 show more modest trends.[3]
A study attempting to reconcile previous discrepancies among different sources of observations on typhoon intensity in the region identifies a trend of stronger, but fewer events.[9]
Studies attribute the increasing intensity of Northwest Pacific Typhoons to climate change
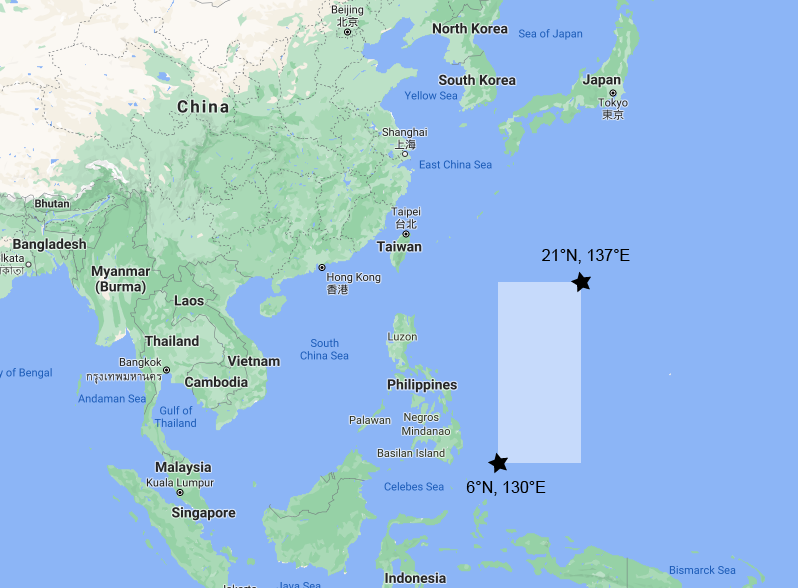
(Xiao 2021): The fingerprint of climate change is identified in the increase of tropical cyclone landfalls in the northwest Pacific since 1980. Results also show that tropical cyclones forming in the sea surface near land (6°–21°N, 130°–137°E) have been more likely to intensify to super tropical cyclones in recent years, mainly due to the increase in the intensification rate, which increases with increased sea surface temperature (SST).
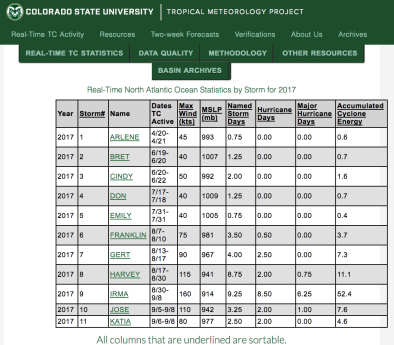
(Zhang et al. 2017): In 2015, accumulated cyclone energy (ACE) in the western North Pacific was extreme, and human-caused climate change "largely increas[ed] the odds of the occurrence of this event," according to the fifth edition of "Explaining Extreme Events from a Climate Perspective" by the Bulletin of the American Meteorological Society.[1]
Additional information
Looking toward the end of the 21st century
By late this century, models project a slight decrease in the annual number of tropical cyclones, but an increase in the number of the strongest (Category 4 and 5) hurricanes. Almost all existing studies also project greater rainfall rates, with projected increases of about 20 percent near the center of hurricanes.[12]
Global trends
Visit Intense Cyclone, Hurricane, Typhoon Frequency Increase to discover climate change links to global tropical cyclone trends.


