
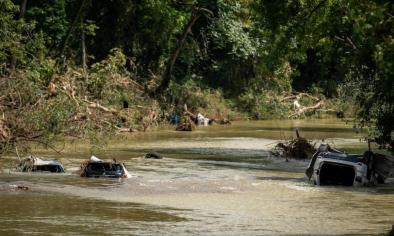
Runoff and Flood Risk Increase
More intense rainfall events and regional increases in precipitation linked to climate change are increasing the risk of extreme runoff and flooding in some locations. Precipitation is a major driver for river discharge trends and for changes across annual and decadal time scales.
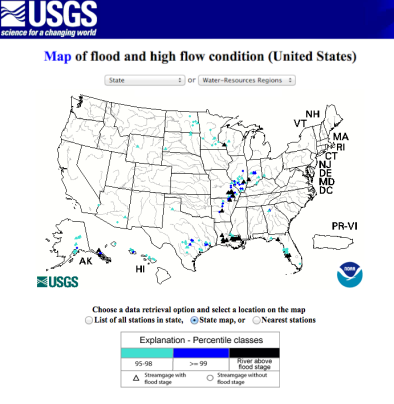
Streamflow levels are increasing alongside the increased frequency of heavy precipitation events across most of the US. In the largest rivers, including the Ohio, Missouri, and Mississippi, the number of days with high stream flow (the top 25 percent of readings) has risen over the past 30 years (1987-2016).[1]
Read More
Background information
What factors affect runoff and flooding?
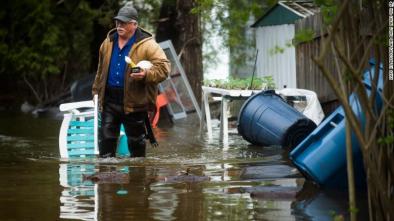
Heavy precipitation is contributing to increased runoff and flood risk around the world. Flooding is worsened by regional climate trends such as increases in heavy rain and snow, early snowmelt, and increased seasonal precipitation.
Flooding is also affected by non-climatic factors such as land development, deforestation, levee placement and local topography, making it challenging to determine an overarching climate signal in flood trends.
US runoff and flood risk increase trends and climate change
- The US National Climate Assessment observes that large increases in heavy precipitation have occurred in the Northeast, Midwest, and Great Plains, where heavy downpours have frequently led to runoff that exceeded the capacity of storm drains and levees, and caused flooding events and accelerated erosion.[1]
- Annual runoff and streamflow have increased in the Mississippi Basin and Northeast.[2]
- In the largest rivers of the US, including the Ohio, Missouri, and Mississippi, the number of days with high stream flow (the top 25 percent of readings) has risen over the past 30 years (1987-2016).[3]
- Outside of the Mississippi Basin and Northeast, there are no clear trends in annual runoff,[2] although a declining trend is emerging in annual runoff in the Colorado River and Rio Grande Basins.[4]
- A May 2017 paleoclimate study of runoff ratio—the portion of precipitation that ends up in the river each year, rather than evaporating—for the Upper Rio Grande basin finds a declining trend in runoff ratio from the 1980s to present day that is unprecedented in the last 445 years.[5]
- Runoff and streamflow have also declined in some locations in the last half-century, notably in the Northwest.[6]
- Models project that annual runoff and related river-flow will decline in the Southwest and Southeast and increase in the Northeast, Alaska, Northwest, and upper Midwest regions broadly mirroring projected precipitation patterns.[1]
US studies attribute extreme precipitation to climate change
- (Huang et al. 2018): Historical warming reduced 2016–2017 Sierra Nevada snow water equivalent by 20 percent while increasing early‐season runoff by 30 percent. Historical warming may have exacerbated runoff conditions underlying the Oroville Dam spillway overflow in February 2017.[7]
- (Trenberth et al. 2018), (Wang et al. 2018), (Risser and Wehner 2017), (Van Oldenborgh et al. 2017), and (Emanuel 2017) find that climate change increased the extreme precipitation observed during Hurricane Harvey responsible for most of the flooding.[8][9][10][11][12]
- (Wang et al. 2017): The dramatic switch from extreme drought to severe flooding in California, and the accompanying flip from atmospheric ridge to trough in the northeastern Pacific, exemplifies the pathways to an intensified water cycle under a warming climate.[13]
- (Van der Wiel et al. 2017) and (Wang et al. 2016) find that global warming increased the probability of extreme precipitation responsible for most of the flooding in the Central Gulf Coast during the extreme rainfall event of August 12-14, 2016.[14][15]
Global runoff and flood risk increase trends and climate change
- A 2009 study by Dai et al. looked at the 925 most downstream stations on the largest rivers—accounting for 80 percent of the global land area that drains into the ocean and 73 percent of the continental runoff.[16] One-third of the 200 largest rivers (including the Congo, Mississippi, Yenisey, Paraná, Ganges, Colombia, Uruguay and Niger) showed statistically significant trends during 1948–2004, with 45 rivers showing downward trends and 19 showing upward trends.[1][16]
- The IPCC finds that decreases in runoff are likely in southern Europe and the Middle East, while increased runoff is likely in high northern latitudes, consistent with projected precipitation increases.[17]
- Scientists have not observed a consistent long-term trend in discharge for the world’s major rivers on a global scale.[17]
Global studies attribute extreme precipitation to climate change
- (Milly et al. 2002): The frequency of great floods increased substantially during the twentieth century. The emergence of this statistically significant positive trend is consistent with results from numerical simulations of anthropogenic climate change.[18]