Land Surface Drying Increase
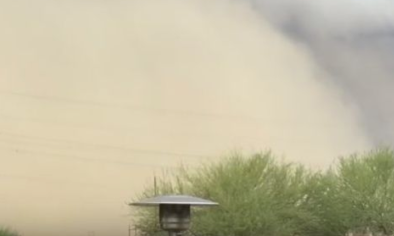
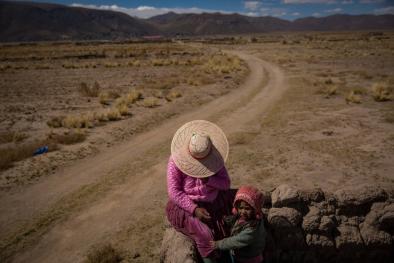
On land, global warming causes the soil to dry out, a process made worse by other climate signals such as permafrost thaw and evapotranspiration, and as rainfall is concentrated in heavy rainfall events with greater runoff. Soil can also dry out due to changes in large-scale circulation, such as the expansion of the Hadley Cell. As the Hadley Cell expands, dry air flowing from the tropics falls in the subtropics creating regions that are more arid. As aridity increases, dry land degrades and loses its water, vegetation and wildlife.
Read More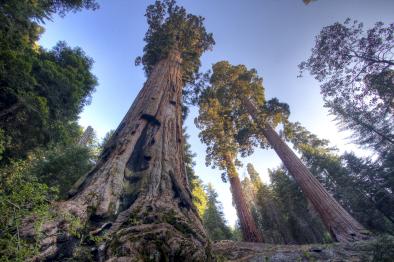

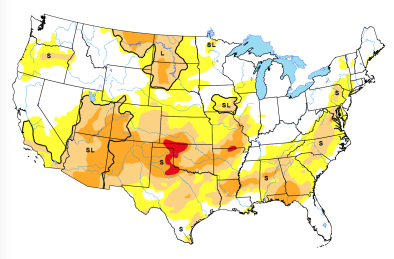
Global drying trends
Global warming is changing the pattern of wet and dry areas around the world. Scientists have broadly observed, and continue to expect, that climate change leads to dry regions getting drier, and wet regions wetter.
From 1979 to 2013, a study analyzing soil moisture from satellite data found that 30 percent of global land experienced robust moisture trends, with 22.16 percent becoming drier, and 7.14 percent becoming wetter.[1]
Another study analyzing annual mean soil moisture trends from 1948 to 2010 identified significant trends for 40.6 percent of the global area, with 60.2 percent of this area experiencing drier conditions, and 39.8 percent wetter.[2] The most prominent drying trends occurred in northern Africa, East Asia, eastern Australia, and southern Europe, whereas subtle increases in soil moisture were observed for the central US, South America, and western Australia.
By 2100, models project that many regions—including, the Mediterranean, Southwest US and southern Africa—are likely to get drier should greenhouse gas emissions continue unabated.[3]
Evapotranspiration and the water cycle
Evapotranspiration—the evaporation of moisture from soil, from the surface of plants and trees, and from water bodies; and transpiration, the use and release of water from plants—is one of the major factors regulating land surface moisture. Climate change is able to affect evapotranspiration through its influence on temperature, wind, humidity, and water availability.[4] Evapotranspiration is the second largest component of the water cycle after precipitation, and changes to this process have far reaching consequences, because it serves to regulate land surface soil moisture, groundwater recharge and runoff.[5]
Scientists use the difference between the amount of moisture the atmosphere demands from soil and water surfaces—a quantity known as potential evapotranspiration—and precipitation to measure dryness and drought.[6] Changes in potential evapotranspiration are likely to occur where temperatures are the highest and can lead to soil moisture deficits and more severe droughts.[7]
Because many climate factors influence the flux of moisture into the air, the net effect of global warming on evapotranspiration is still an area of active research, though scientists have observed robust regional trends.
Global evapotranspiration trends
The rate of evapotranspiration increased globally between 1982 and 1997 but stopped increasing, or has decreased, since about 1998.[8] In North America, the observed decrease in evapotranspiration occurred in water-rich rather than water-limited areas.
Scientists have identified several factors that are likely contributing to the decrease in evapotranspiration, including wind speed,[9] decreasing solar energy at the land surface due to increasing cloud cover and concentration of small particles (aerosols),[10] increasing humidity,[9] and declining soil moisture.[4]
Potential evaporation—the amount of moisture that the air demands—is anticipated to increase as the world warms, but much more research is needed to confidently identify historical trends, causes, and implications for future evapotranspiration trends. This represents a critical uncertainty in projecting the impacts of climate change on regional water cycles.[4]
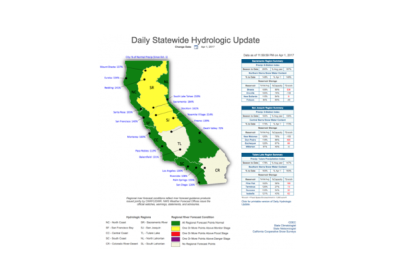
California trends
There is scientific consensus that global warming has worsened drought in California through increased evapotranspiration. In one study, scientists analyzed 432 different combinations of precipitation, temperature, wind and radiation data gathered between 1901 and 2014 to simulate monthly changes in soil moisture across the state.[11] They found that between 8 and 27 percent of the overall drought severity between 2012 and 2014 was due to human-caused warming. The findings suggest that within a few decades, continually increasing temperatures and resulting moisture losses will make California even drier.
Scientists are still working to understand how evapotranspiration in California responds to increased greenhouse-gas concentrations, because of the complex response of cloud cover and humidity to climate change.[6] Clouds keep the planet cooler than it would be otherwise by reflecting sunlight back to space. However, a study published in April 2016 suggests that clouds may not offer as much protection against sunlight as once thought.[12]
Hadley Cell Expansion
Model projections indicate that the Hadley Circulation will shift its downward branch poleward in both the Northern and Southern Hemispheres, causing drying as a result.[3]
Scientists have already observed a poleward shift of the southern Hadley Cell.[3]