

Drought Risk Increase
Global warming drives drought through changes in both precipitation and temperatures that vary by region. Depending on a region’s latitude, climate change can reduce or increase the total annual precipitation. It can also concentrate the year’s precipitation into fewer but heavier downpours. This can lead to more runoff, which contributes to drought. Global warming can also raise local temperatures and drive more frequent and intense heat waves, all of which can dry out land and prompt the early melt of snowpack, another contributor to drought.
Read MoreApr 28, 2022
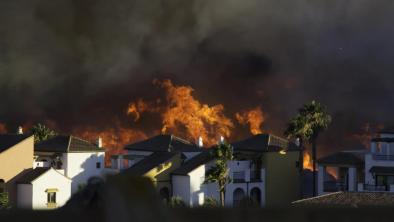
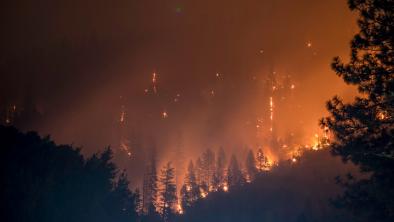
Western Wildfire Season 2022
Oct 20, 2020
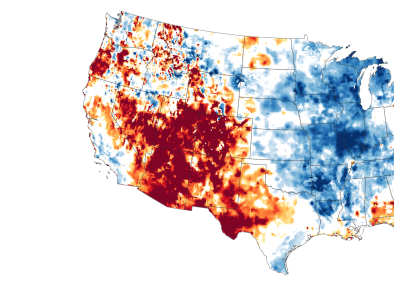
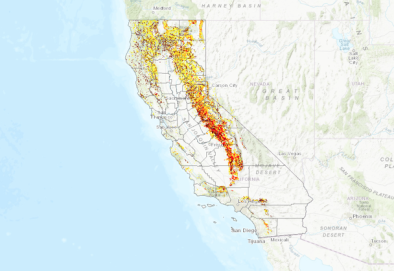
Western Drought 2020-2022
Nov 20, 2019
California Water Year 2019-2020
Aug 19, 2021 | NBC News
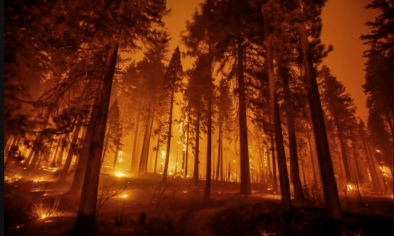
Caldor Fire explodes more than 8 times its size to nearly 54,000 acres in a day
Aug 18, 2021 | The Washington Post
Wildfires explode again in the West, fanned by turbulent winds
Aug 16, 2021 | NBC News
Heat waves, wildfires & drought: How this summer is a 'preview' of Earth's coming climate crisis
Sep 5, 2017 | Cal Fire | US Forest Service
California Tree Mortality Viewer
Aug 16, 2017 | Princeton
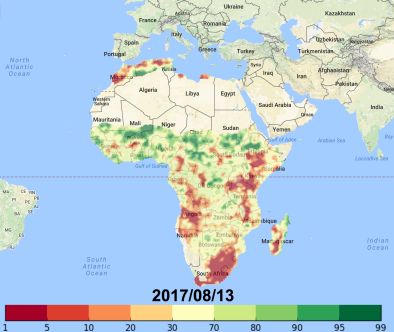
Africa Flood and Drought Monitor
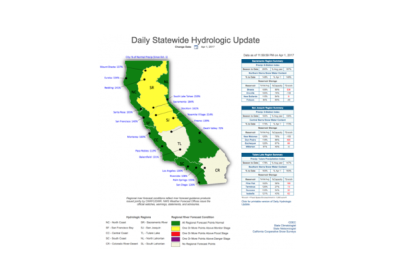
Apr 4, 2017 | California Department of Water Resources
California Daily Statewide Hydrologic Update
Mar 24, 2021 | Proceedings of the National Academy of Sciences
Increased drought severity tracks warming in the United States’ largest river basin
Mar 10, 2021 | Geophysical Research Letters
A Later Onset of the Rainy Season in California
Mar 10, 2021 | Environmental Research Letters
Increasing importance of temperature as a contributor to the spatial extent of streamflow drought
US drought trends and climate change
- Winter temperatures, winter snow days, snow pack moisture (snow water equivalent), and stream flow (runoff) have changed significantly for much of the mountainous Western US; this change is strongest for temperatures and snow days (compared to snow pack moisture and streamflow), and for the Pacific Northwest (compared to the Southwest).[1]
US studies attribute drought to climate change
- (Milly and Dunne 2020): Climate change is responsible for half of the 16 percent decrease in flow in the Colorado River between 2000 and 2017.[2]
- (Williams et al. 2019): In 2018, hotter temperatures decreased the snowpack water content in the US four corners region by 20 percent and reduced vegetation greenup — a proxy for rangeland conditions.[3]
- (Hoell et al. 2019): Climate change (via warmer temperatures) made the 2017 Great Plains (the Dakotas and Montana) drought 50 percent more likely.[4]
- (Wang et al. 2019): Warmer temperatures from climate change exacerbated the 2017 Great Plains (the Dakotas and Montana) drought.[5]
- (Lehner et al. 2018): Much of the drying trend in the US Southwest has been due to natural variations in rainfall/snowfall; however, climate change-driven warming has significantly exacerbated that drying.[6]
- (McCabe et al. 2017): Climate change driven hotter summertime temperatures have reduced the Colorado river streamflow by 7 percent.[7]
- (Williams et al. 2017): Hotter temperatures contributed to 28 percent of the severity of the Southeastern US 2016 drought, making it the second most severe since 1895.[8]
- (Rupp et al. 2017): Climate change has made extreme precipitation deficits (like those in the Central US in summer 2012) 3 to 4 times more likely.[9]
- (Udall and Overpeck 2017): Warmer temperatures (0.9C) contributed to 1/3 of the observed low streamflow in the Colorado River during 2000-2014.[10]
- (Fosu et al. 2016): Despite normal precipitation, climate change driven-warmer temperatures led to reduced snowpack in the Pacific Northwest during the 2014-2015 winter, driving drought.[11]
- (Weiss et al. 2009): Climate change-driven warming has increased the severity of recent droughts in the US Southwest, particularly from 2000-2010.[12]
- (Hidalgo et al. 2009): Climate change has led to earlier snowmelt-driven streamflow (earlier beginning and end of peak flow) in the mountainous Western US.[13]
- (Pierce et al. 2008): Half of the reduction in late winter/early spring snowpack in the mountainous Western US is due to warmer temperatures from climate change.[14]
- (Barnett et al. 2008): The hydrologic cycle in the Western U.S. has changed significantly since the 1950s. Human-induced temperature rise has driven up to 60 percent of the change in decreased snowpack water content and earlier runoff.[15]
Visit California Drought 2011-2017 for detection and attribution studies related to this specific event.
Global studies attribute drought to climate change
- (Marvel et al. 2019): Human-induced climate change influenced drought trends in the early twentieth century (1900-1949). Mid-century it is not detectable due to aerosol emissions. Late century it is somewhat detectable.[16]
- (Diffenbaugh et al. 2017): Climate change increased the probability and severity of the driest year on record — that is, the year that experienced the least amount of precipitation — in 57 percent of the observed areas of the world from 1901–2010.[17]
- (Najafi, Zwiers, & Gillet, 2016): Internal variability (without climate change) could not explain observed reductions in March through June snow cover extent for the Northern Hemisphere. In North America, it is particularly the case for March-April.[18]
- (Chan and Wu 2015): Climate change has driven an expansion of semi-arid conditions across Western North America.[19]
- (Rupp et al. 2013): Snow cover in the Northern Hemisphere has declined, and cannot be explained by natural variability (without climate change) alone.[20]


Earth Systems Signals
Global warming is causing widespread and rapid changes in the atmosphere, ocean, cryosphere and biosphere.
Heat Signals
The Earth is getting hotter due to human activities that release heat-trapping gases into the atmosphere.
Drought Signals
Climate change is making droughts more likely to occur, and more severe when they do.
Wildfires Signals
Climate change is increasing the size, frequency, intensity and seasonality of wildfires.
Hurricanes Signals
Warmer temperatures increase the rate of water evaporation, which feeds moisture and energy into storms.
Floods Signals
Worsening floods due to climate change are putting a growing number of communities at risk.
