California Water Year 2019-2020
California's wet season featured a late start, record dryness in February, above average temperatures, and bifurcated spring precipitation patterns in Northern and Southern California. As summer approaches, statewide snowpack is at half the historical average, increasing the risk of an early wildfire season.
The Sierra Nevada snowpack serves as a natural water storage system that feeds California's waterways and reservoirs during the dry summer months. The 2020 snowpack is lower than average and provides some foreshadowing for a future under anthropogenic warming.
Valerie Trouet, Associate Professor of Dendrochronology at Arizona State University.


Climate science at a glance
- California depends upon snowpack for roughly one third of its water supply.
- Warming temperatures are shifting snowfall to rainfall and driving a more pronounced and earlier snow melt, increasing the length of the dry low-runoff period and potentially reducing surface soil moisture.
- California dams, many of which are managed to provide both water storage and flood control, are increasingly challenged as the run-off season increasingly overlaps with the wet season. The demand for water storage calls for capturing as much run-off as possible, yet the demand for flood control calls for maintaining reduced reservoir levels behind dams, making it difficult to capture early run-off during the wet season.
- Global warming is increasing the strain on water supplies in California through rising temperature, even in wet years.
Background information
California wet season 2019-2020 summary
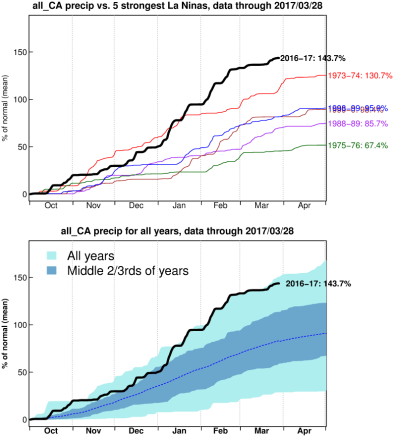
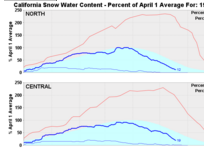
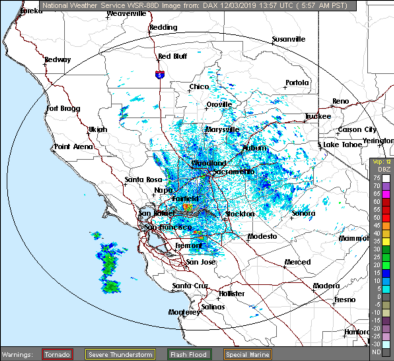
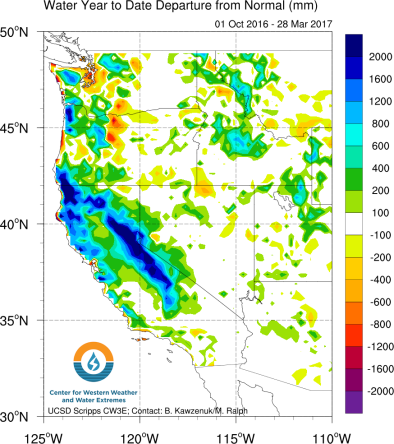
California's wet season got off to a slow start, but a series of storms in late November and early December inundated the state, leading to an abrupt end to the fire season. By mid-December, precipitation was near or above average in central and southern California. Dry conditions returned for much of the state in January, and most of California experienced its driest February on record. Temperatures during February were also well above average. While precipitation picked up in March for Southern California, state-wide snowpack in mid-March was at only 38 percent of average for the date. The dry north/ wet south precipitation pattern continued in March and April, with some locations in Southern California even setting many daily precipitation records as northern California drought conditions deepened. Statewide snowpack conditions at the end of April were below 50 percent of the historical average for the date.

Climate signals breakdown
Climate signal #1: Drought Risk Increase
Climate change has exacerbated drought in parts of the US primarily by decreasing the snowpack and already small amount of water available in streams and soils. Most droughts are driven by natural variability in precipitation. Climate change-driven hotter temperatures, however, melt snowpack earlier, evaporate water in streams and lakes, and evaporate water from soils, turning what would have been a moderate drought into a much more severe drought. In some limited cases, there is also evidence that climate change is changing rainfall patterns, blocking rain from reaching areas in need of water. These combined effects have made what may have been moderate droughts severe or exceptional instead.
Observations consistent with climate signal #1
- California had its driest February on record, and an abnormally dry January.[11]
Climate signal #2: Precipitation Falls as Rain Instead of Snow
Temperature and precipitation both affect water supplies. Rising temperatures have a larger effect at locations and elevations near the freezing level where small changes in temperature can determine whether snow packs melt and whether precipitation falls as rain or snow. Changes in precipitation become more important at in colder locations and higher elevations where they determine whether any or how much precipitation falls.[1]
With incremental warming, significant fractions of snowfall events shift to rainfall events.[2] Across California, 68 percent of weather station located between 2,000 and 5,000 feet registered a lower percentage of winter precipitation falling as snow, according to 65 years of winter precipitation data.[3]
Because winter temperatures in the Sierra Nevada mountains are often near the thawing threshold, a small difference in the temperature of passing weather systems often determines whether precipitation falls as snow or rain.[4] Rain-on-snow-producing atmospheric river storms are, on average, only 2°C warmer than others storm types that preserve snow pack.[4] Weather systems passing through California originate globally, and the average global increase in temperature has been 1°C, indicating significant risk that storms arriving in California may be warming and converting additional snow pack to mountain run-off.
The ratio of snow pack (measured in snow water equivalent) to overall precipitation (SWE/P) is an indicator of a temperature-driven snow-melt signal on western US snow pack.[1] The SWE/P ratio shows what fraction of current water year precipitation remains in the snow pack for any given day of the water year: the closer SWE (snow water equivalent) is to P (overall precipitation), the more water resources remain.[1]
Long-term climate warming is strongly correlated with declining snow water equivalent and shifts in stream flow throughout the American West and appear to be largely explained by decreased spring accumulation and/or increased spring melt.[2] At broad scales the fingerprint of anthropogenic warming contributing to these shifts has been formally identified.[5][1][6][7]
Observations consistent with climate signal #2
- The average statewide temperature from December through February was 2.7°F above the 1901-2000 average.
- In February, record spring or even summer-like warmth occurred.
Related Content