Record Arctic Warmth 2016
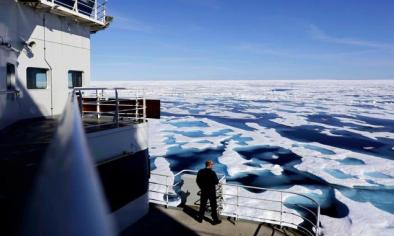
The Arctic continues to be one of the fastest warming regions on the planet, heating up at a rate more than twice the global average.[1] Arctic sea ice has been in decline since at least the 1970s due to climate change, and research shows the thinning is accelerating.
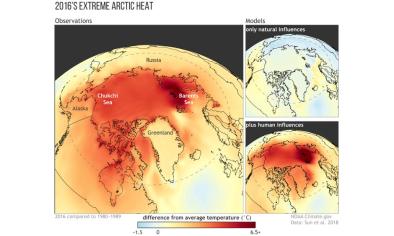
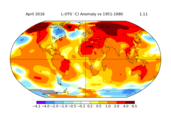
According to NOAA's 2016 Arctic Report Card, the average annual surface air temperature anomaly (+3.6°F/2.0°C relative to the 1981-2010 baseline) over land north of 60°N between October 2015 and September 2016 was by far the highest in the observational record beginning in 1900.[2] A 2018 study found a near-zero probability for an Arctic heat event as extreme as 2016's occurring in the absence of human-caused climate change.[3]
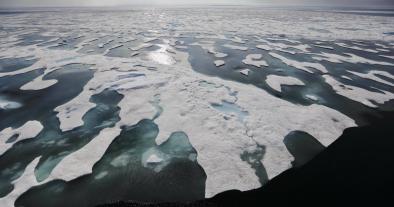
March 2016 brought the lowest annual maximum sea ice extent measurement ever recorded, beating the previous record set in 2015.[4] On September 10, 2016, Arctic sea ice extent stood at 1.60 million square miles, the second-lowest minimum sea ice extent on record, tied with 2007.[5] October 2016 sea ice extent set a record low for the month—notable as October is typically the first full month when sea ice grows in the region.[6]
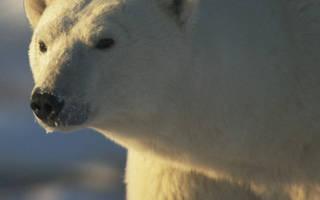
Climate change is causing the Arctic to warm at twice the global rate and is accelerating sea ice melt
One of the clearest consequences of climate change is greater surface warming in the Northern Hemisphere high altitudes, including the Arctic, relative to low or middle latitudes.[1]
During the past few decades the Arctic has warmed approximately twice as rapidly as has the entire northern hemisphere, a phenomenon called Arctic Amplification (AA).[2] The widespread warming is due to a combination of increased greenhouse gases and positive feedbacks involving sea ice, snow, water vapor, and clouds.[2]
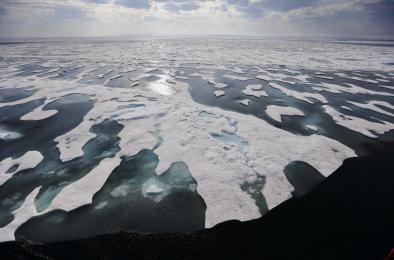
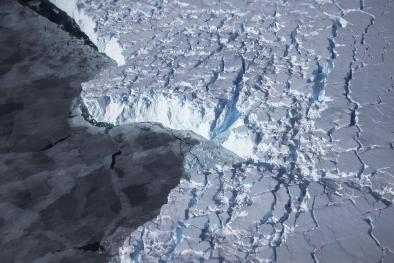
Arctic sea ice has been in decline since at least 1979—when satellite measurements began—due to climate change, and the thinning is accelerating. The decline has been greatest during summer, for which the rate of decrease of ice extent since 1979 has been approximately 12 percent per decade.[3] Summer sea ice in September thinned 85 percent (from 9.8 feet to 1.4 feet, or 3 to 0.43 m) between 1975 and 2012.[4] The area of summer sea ice lost since the 1980s would cover over 40 percent of the contiguous United States.[2]
Factors contributing to the rapid ice loss of the past decade include warming air temperatures, changes in the amount of the Sun's energy that the Earth absorbs, changes in air circulation, and changes in the amount of heat transferred in the ocean that affect sea ice from below.[3]
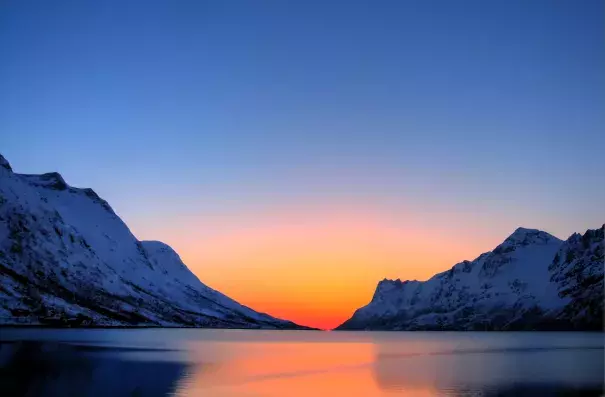
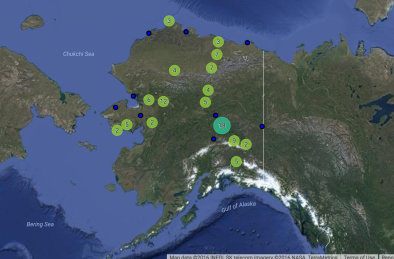
Winter 2015-2016 topples heat records in Alaska
The 2015-2016 winter—December through February—was the warmest on record in the US, and the second-warmest in Alaska, which clocked in a “freakish” 10.6°F above average.[5] Several locations across Alaska were record warm including Barrow and King Salmon, while Anchorage and Juneau had their second warmest December-February. According to the National Snow and Ice Data Center (NSIDC), January 2016 air temperatures at the 925 hPa level were 11 to 14°F above the 1981-2010 average over the central Arctic Ocean near the pole.
Winter 2015-2016 sea ice maximum hits yet another record low
On March 24, 2016, just four days after the end of astronomical winter[6]—which saw temperatures from 11 to 14°F above average in the central Arctic—sea ice in the Arctic hit 5.607 million mi² (14.52 million km²), its lowest annual maximum since records began in 1979.[7]
“I’ve never seen such a warm, crazy winter in the Arctic,” said NSDIC director Mark Serreze.[8]
Arctic sea ice in 2016 was 430,000 mi² (1.12 million km²) below the 1981-2010 average, and 5,019 mi² (13,000 km²) below last year’s record low. Most of the Arctic experienced above-average temperatures all winter, with temperatures occasionally reaching more than 20°F above average. NSDIC said that these unusually warm temperatures “no doubt” played a role in the record low ice extent.
Summer 2016 sea ice minimum becomes second-lowest on record
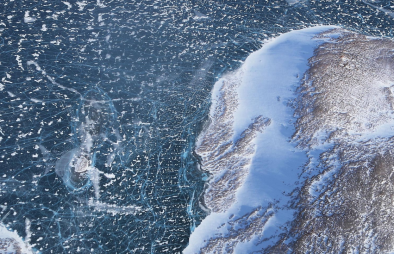
2016 tied 2007 as the year with the second smallest summer sea ice extent since record-keeping began in 1979.[9] Total ice cover on September 10, 2016 clocked in 1.60 million square miles (4.14 million square kilometers).[9]
2012 holds the record for all time lowest sea ice extent at 1.31 million square miles (3.39 million square kilometers), yet the early September rate of decline in 2016 greatly exceeded the rate observed for the same period in 2012.[9]
2016's low summer sea ice extent fits with the decades-long trend showing a rapid decrease in sea ice extent. The decline has been greatest during summer. Ten out of ten of the lowest summer sea ice extents since 1979 occurred in the ten years leading up to and including 2016.[3]
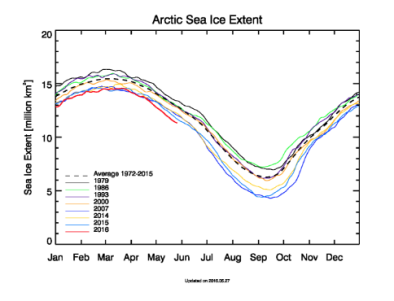
Fall 2016 brings extreme heat and record low October sea ice
 After summer sea ice extent dipped to its second-lowest on record, abnormally warm land and ocean temperatures slowed sea ice re-growth, leading 2016 to surpass the record year of 2012 for lowest sea ice extent on record in October (see Arctic sea ice extent image to the right).[10][11][12]
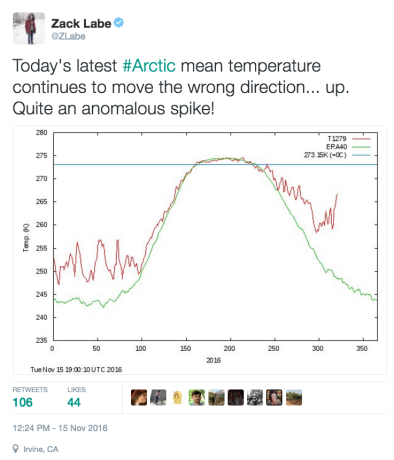
In mid-November, Arctic temperatures in the region above 80°N latitude reached 36°F (20°C) higher than normal.[13] According to Arctic researcher Jennifer Francis, “The Arctic warmth is the result of a combination of record-low sea-ice extent for this time of year, probably very thin ice, and plenty of warm/moist air from lower latitudes being driven northward by a very wavy jet stream.”[11]
The authors of a 2018 study in Weather and Climate Extremes concluded that human-caused climate change was likely responsible for about 60 percent of the 2016 Arctic warmth.[14] The study found a near-zero probability for such an extreme heat event occurring in the absence of human-caused climate change.[14]
Melting ice and water redistribution shifts North Pole drifting
Global warming appears to be shifting the drifting direction of the North Pole so far this century due to the melting of polar ice and redistribution of water on land. The Earth's rotational axis, or physical North Pole, used to drift toward Canada's Hudson Bay and Toronto at a rate of about 4 inches per year until about 2000.
But scientists say the shrinking of ice sheets in Greenland and Antarctica, along with water changes on land, have caused the North Pole to make a sharp 75-degree shift toward the east, in the direction of London.[15]
Related Content