Science Source
Spatial analysis and temporal trends of daily precipitation concentration in the Mantaro River basin: central Andes of Peru
- States that a high percentage of total annual precipitation can fall in just a few days, causing floods or landslides
- States that large economic losses from these events are particularly common in Peru, where the daily precipitation has been poorly investigated
- States that regions such as the Mantaro River basin (MRB) in the central Andes of Peru are highly vulnerable to extreme weather events associated with climate variability; this vulnerability will increase in coming years due to climate change
- Presents a spatio-temporal analysis of concentration index over the Mantaro River basin in the central Peruvian Andes
- Selects daily rainfall data recorded at 46 rainfall stations between 1974 and 2004
- Finds that daily rainfall (in terms of average values) indicates that low-intensity events account for 36 % of rainy days but only approximately 9 % of the total rain amount
- Finds, in contrast, high- and very high-intensity events account for 37 % of rainy days and approximately 72 % of the total rain amount
- The results also indicate higher concentration and lower intensity over the Northern and Central regions, compared to Southern region of the basin
- States that rainfall concentration gives evidence of why some of these places are more likely to be affected by extreme weather events; spatial distribution of event intensity can be partly explained by daily rainfall heterogeneity and orography
- Finds a significant change toward a weaker seasonality of daily precipitation distribution over high-mountain regions
- Estimates annual irregularity of daily precipitation (CI) to detect possible trends between 1974 and 2004
- Finds that for the heavy precipitation period (January–March), the number of rain stations with positive CI trends is much higher than those with negative trends
Related Content
Headline
Apr 19, 2017 | The Guardian via AFP
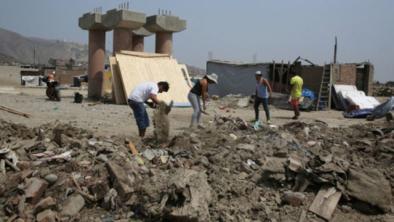
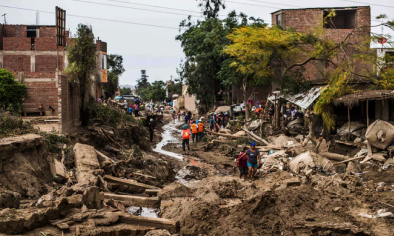
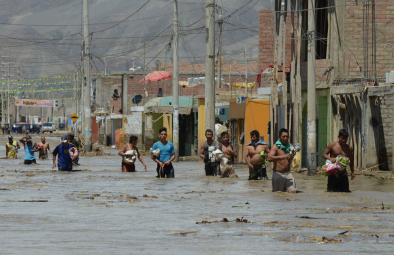
Death toll rises to 113 in Peru floods, mudslides
Headline
Apr 13, 2017 | the Guardian
How can Peru prepare to withstand more devastating floods and landslides?
Headline

Apr 9, 2017 | ReliefWeb
Heavy rains cause landslides, flooding in Colombia and Peru
Headline
Apr 7, 2017 | Inside Climate News
Peru's floods follow climate change's deadly trend
