Science Source
Response of Extreme Storm Tide Levels to Long-term Sea Level Change
- Finds that the monthly highest and lowest water levels at 117 NOAA/National Ocean Service water level stations show a clear response to local mean sea level trends
- Adjusts the extreme levels reached by hurricanes and extra-tropical storms of the past for sea level trend
- Derives a data set of the annual highest and lowest water levels from the monthly data and uses this to determine the expected frequency of future storm tides rising above or falling below any given level
- Applies the same analysis to the data for each individual month to estimate the varying likelihood of extreme high or low levels by season
- The results are a set of annual and monthly exceedance probability levels relative to the tidal datums for each station
- States the information should prove useful for identifying, in real time, when a rare event threshold has been crossed
Related Content
Headline
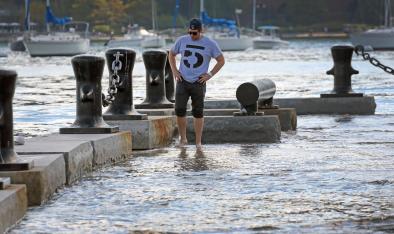
Nov 17, 2016 | The Boston Globe
King tide flooding is a preview of the everyday norm we can expect due to global warming
Headline
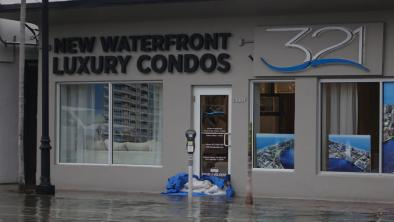
Nov 16, 2016 | South Florida Sun-Sentinel
'Unfortunately, we live in paradise:' With king tides, waterfront residents take the bad with the good
Headline
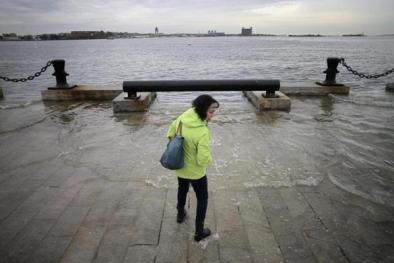
Nov 16, 2016 | The Boston Globe
King tides are back, thanks to the supermoon
Headline
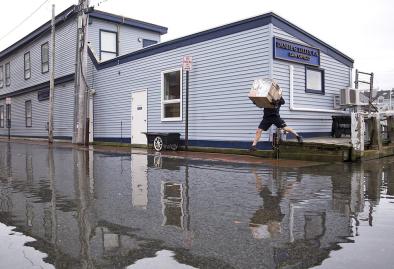
Nov 16, 2016 | The Portland Press Herald
Portland gets minor flooding at supermoon-influenced high tide
