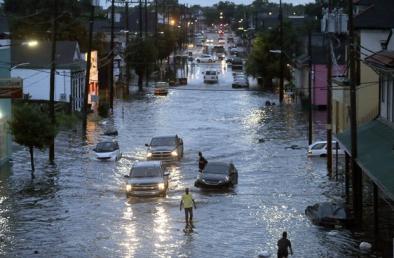
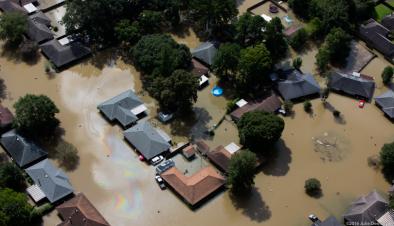
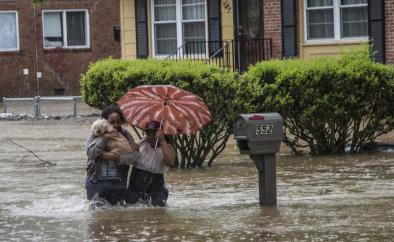
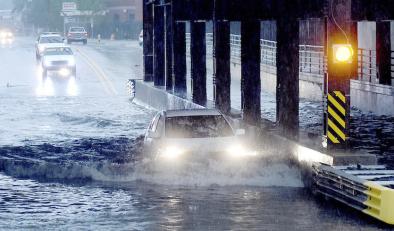
New Orleans Flood August 2017
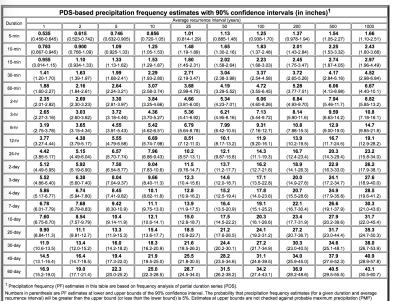
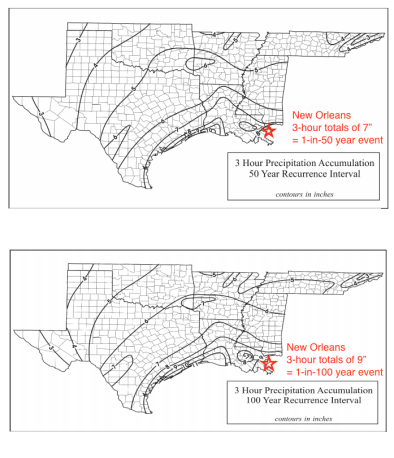
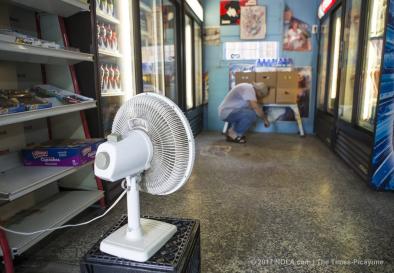
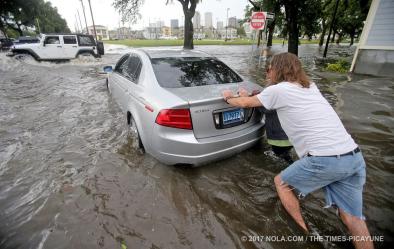
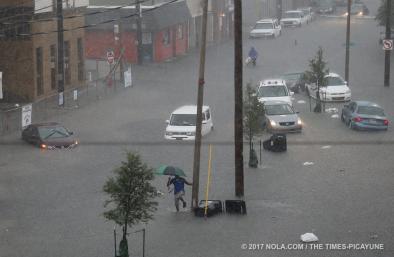
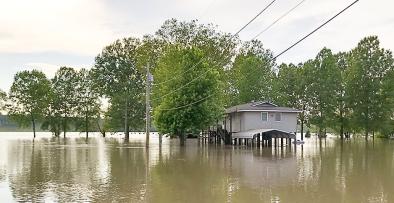
A very small, slow-moving storm pinpointed parts of New Orleans, Louisiana on August 5, dropping heavy rainfall that overwhelmed city pumps and helped to drive heavy flooding. Some neighborhoods witnessed as much as 8 inches of rainfall in the span of three hours[1], an extreme micro-burst expected to occur roughly every hundred years on average according to NOAA rainfall frequency tables and New Orleans city officials.[2][3]
Just two weeks prior the same areas endured extreme rainfall that mounted to as much as 4.5 inches in less than hour[4], a burst expected to occur roughly every fifty years[2]. New Orleans has seen a 62 percent increase in the number of heavy downpours since the 1950s.[5]
Increasing extreme rainfall is one of the clearest observed signals of climate change, and the fingerprint of global warming has been firmly identified in the global trend of increasing extreme precipitation. Back-to-back years of extreme August rainfall events are consistent with the global trend of increasingly frequent extreme and record-breaking rainfall events.
Related Content
US Severe Storms and Floods April - May 2017
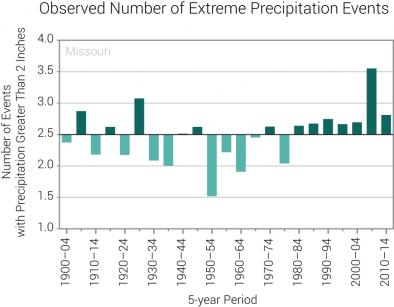
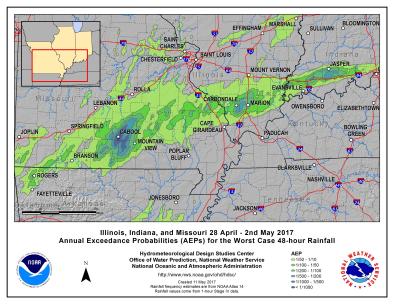
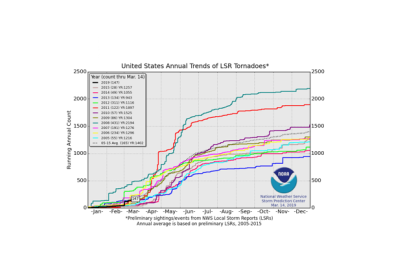
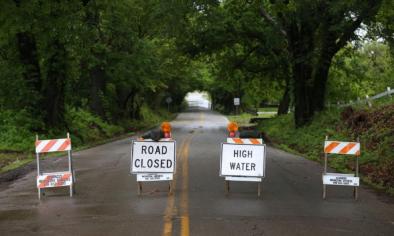
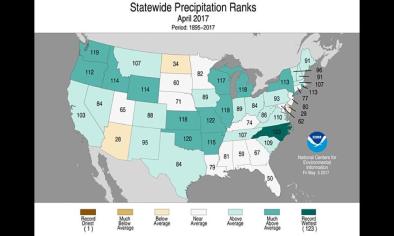
A major slow-moving storm brought heavy rains, dangerous winds, tornadoes, and flooding across much of the central US beginning April 28. States from Oklahoma to Indiana recorded extreme three-day rainfall totals of 5 to 11 inches.[1] Eastern Texas saw two EF-3 tornadoes and Kansas experienced a rare late-season blizzard. An impressively large area of 100- to 1,000-year rains hammered Missouri[2][4] and the Ozarks were hit by record-shattering flood crests. At least 20 people have been killed.[3]
Climate change is amplifying rainfall across all storm types. One of the clearest changes in the weather across the globe and in the US is the increasing frequency and intensity of heavy rain and snow. A warmer atmosphere holds more water, and storms supplied by climate change with increasing moisture are widely observed to produce heavier rain and snow. Climate change may also be linked to the persistence of slow-moving events such as this by driving changes in atmospheric circulation. While global warming may increase the fuel available for tornadoes, it is not yet possible to determine whether and how climate change may be affecting tornado activity. However, in a changing climate this uncertainty signifies increased risk.


Related Content
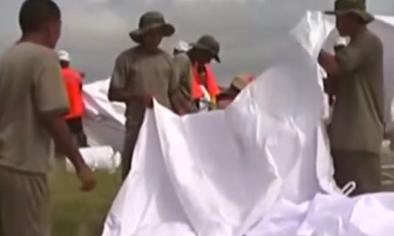
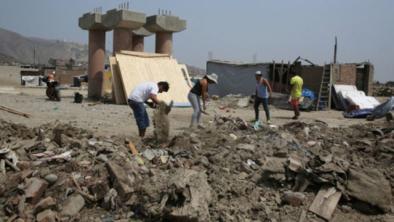
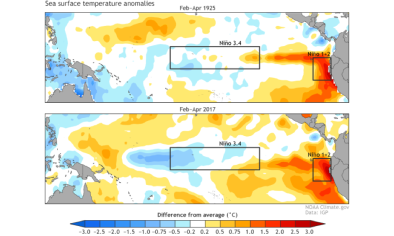
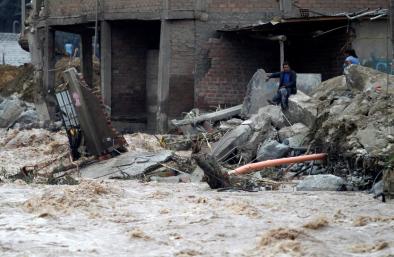
Peru Floods 2017
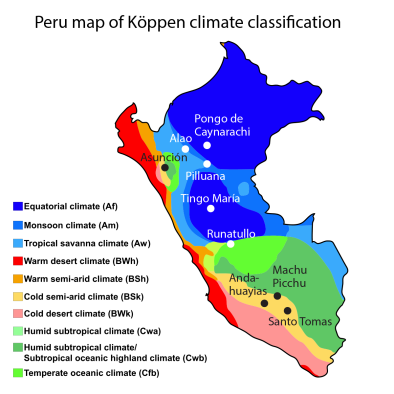
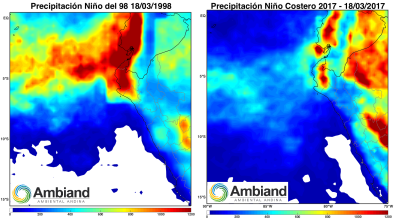
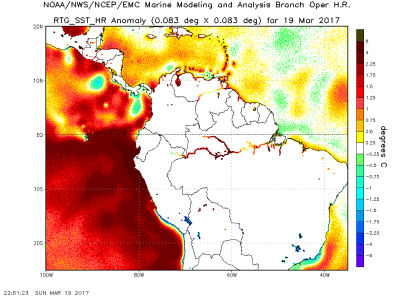
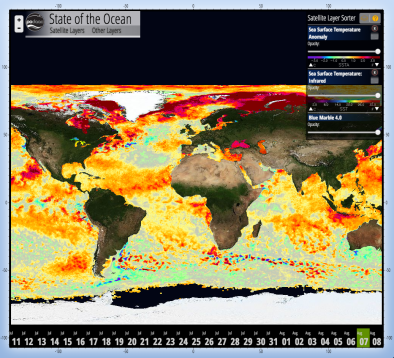
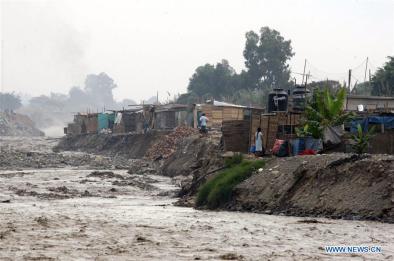
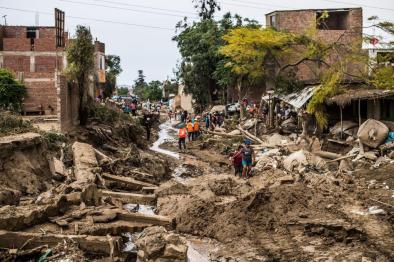
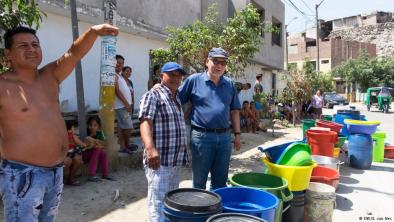
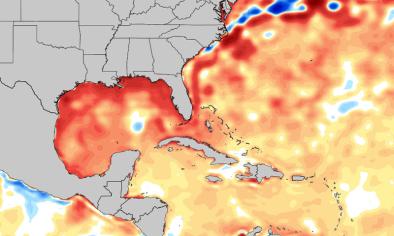
Since January 1, 2017, Peru has witnessed several episodes of extreme downpours, totaling up to 10 times more rain than average, leading to devastating flooding and landslides in Peru's usually semi-arid coastal region and the Andean highlands. The precipitation is clearly and directly linked to extremely warm water off the coast of Peru, which scientists in Peru have tied to a rare "coastal" El Niño event. In Peru's local climate a high percentage of total annual precipitation can fall in just a few days, causing floods or landslides. However, there is evidence that global warming may have helped to amplify the extreme rainfall. These downpours are consistent with the global trend toward heavier precipitation, a trend firmly attributed to climate change. Warmer oceans offer more moisture to passing storms, and warmer air can hold and dump more moisture. Global warming has warmed seas generally and it is possible that this trend may have also bumped the strength of the "coastal" El Niño event. Evidence also suggests that extreme weather events associated with climate variability may be increasing in the area. The heavy rains in 2017 arrived shortly after the country experienced severe drought and wildfires due to the combination of global warming and the after-effects of El Niño. In recent decades, several extreme hydrological events occurred in the Andean-Amazonian region and climate change may be polarizing conditions in Peru, amplifying the flood/drought pattern that has repeatedly visited the country in recent years.

Related Content
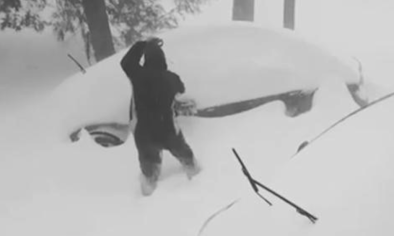
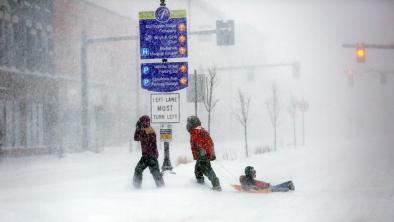
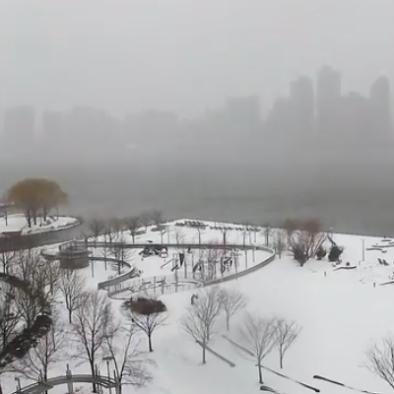
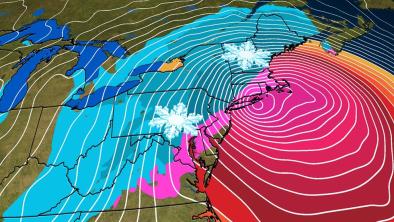
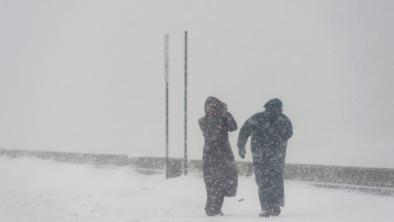
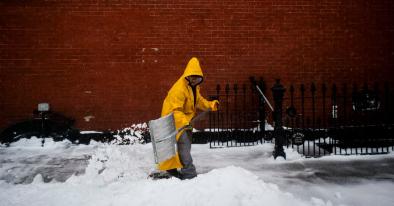
Northeast Blizzard March 2017
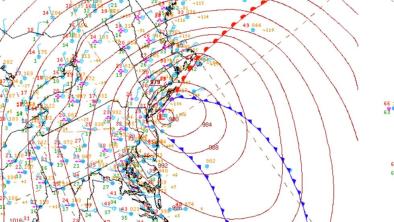
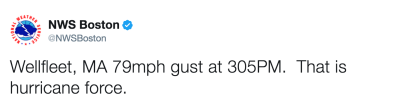
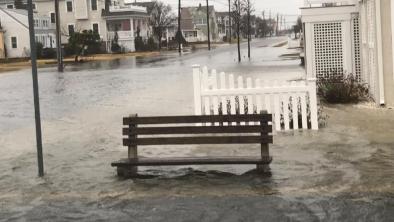
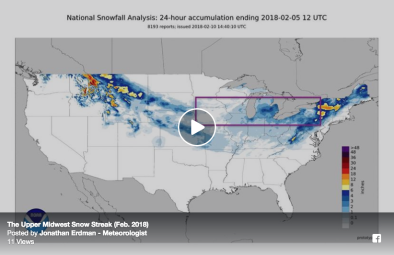
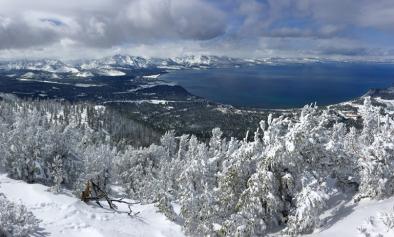
Winter Storm Stella hit the Northeastern United States beginning late on Monday, March 13, bringing up to 42 inches of snow,[1] snowfall rates up to 7 inches in one hour,[1] hurricane force winds,[2] and coastal flooding.[3] The snowstorm was a classic nor'easter but has multiple climate connections that helped to amplify its impact.
Elevated sea levels may have amplified and extended the reach of Stella's storm surge. A warmer atmosphere can hold more water vapor when saturated, increasing blizzard risk as storms like Stella can collect and dump that moisture as extreme snowfall, sleet and rainfall. Before the storm, sea surface temperatures were record warm in the Atlantic Gulf Stream, pumping more heat energy and moisture into the storm, further increasing the risk of blizzard.
The amplification of these physical mechanisms can be seen in the long-term trends. Between 1961 and 2010, there have been twice as many extreme regional snowstorms in the US compared to 1900 to 1960. In New York City, 6 of the 10 all-time biggest snowstorms on record have occurred since 2000. An extreme event driven by natural variability and amplified by climate change is consistent with what science projects for a warming world.
Related Content
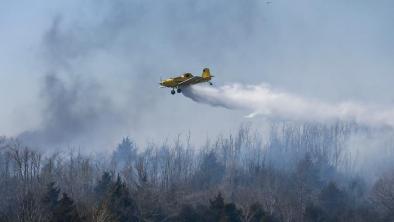
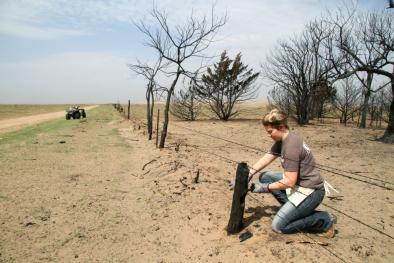
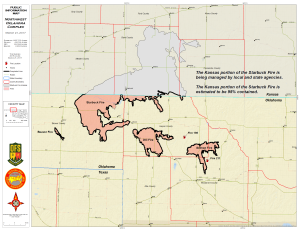
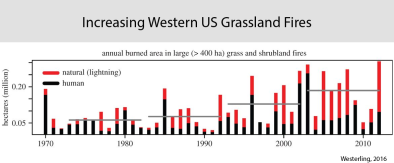
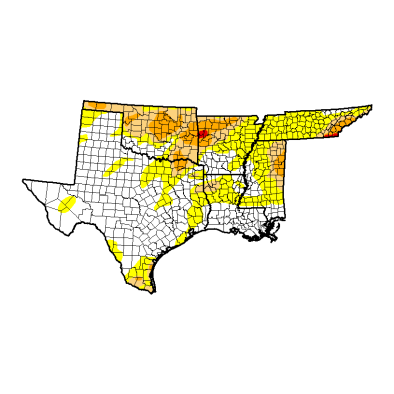
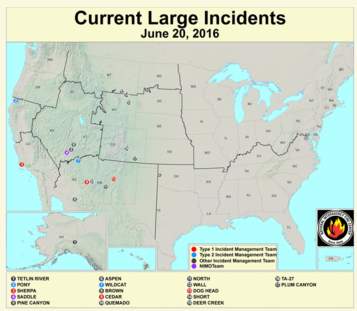
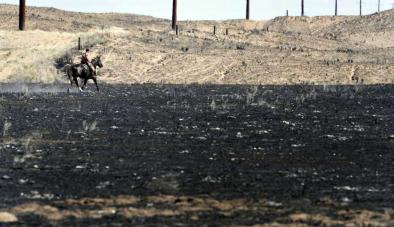
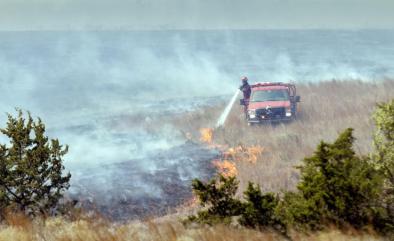
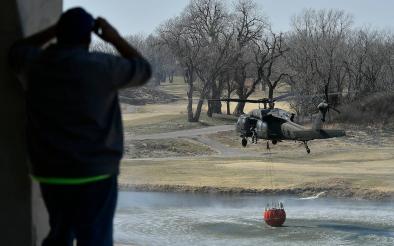
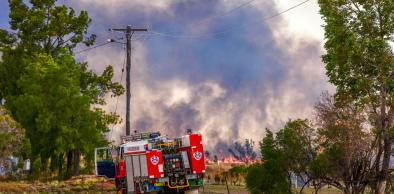
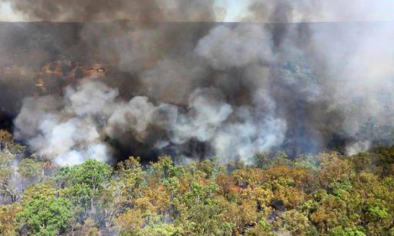
Great Plains Wildfires March 2017
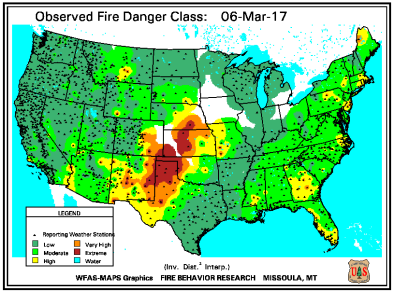
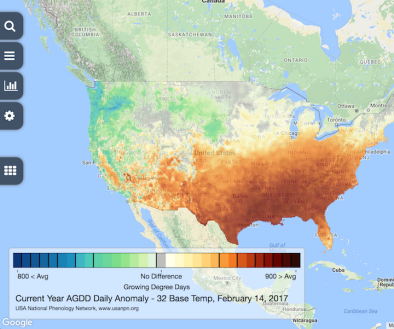
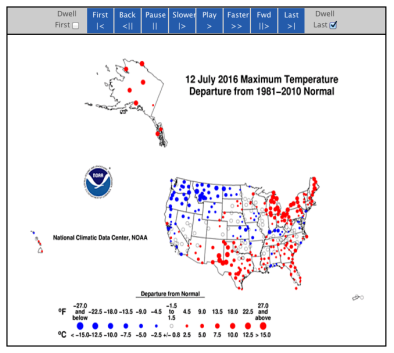
The record-breaking wildfires that erupted in early March in the Great Plains are consistent with the long-term increasing wildfire activity observed in the western US grasslands, activity driven by climate change trends in the Great Plains region.[1] Since the 1970s, large grass and shrubland fires have increased by more than 100,000 acres per decade. The frequency and intensity of wildfires in the Great Plains are increasing as the combination of higher temperatures, untamed underbrush and more extreme drought elevate wildfire risk.
Formal attribution work has identified the fingerprint of global warming in the record hot temperatures that swept across the US east of the Rockies in February 2017, as climate change increased the likelihood of such heat by threefold. The heat fueled worsening drought conditions in the Great Plains region, contributing to the extreme fire conditions in early March that precipitated major blazes in Kansas, Oklahoma, Colorado, and Texas.
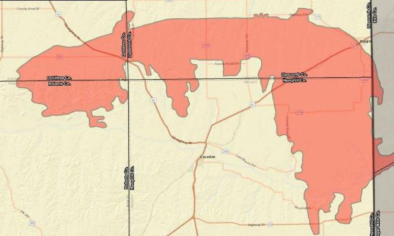
One blaze, encompassing Clark and Comanche counties along Kansas' southern border with Oklahoma, is the largest wildfire on record in the state. The previous record was set just one year prior.[2] Record-breaking events are a classic signal of climate change, as records tend to break when natural variation runs in the same direction as climate change, in this instance towards larger wildfires.
Related Content
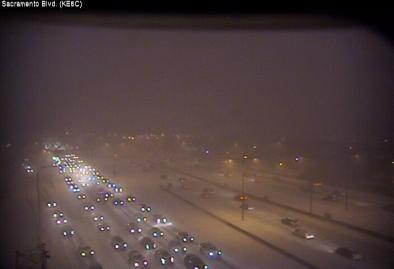
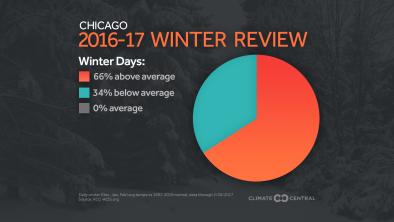
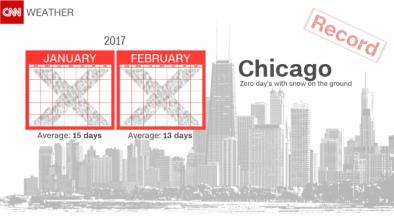
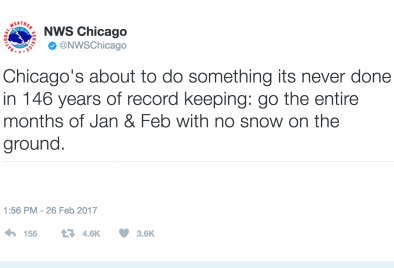
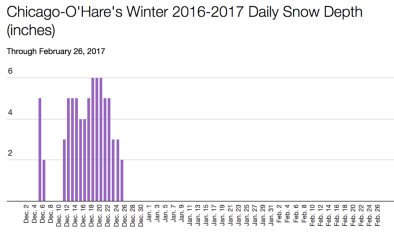
Chicago Snow Drought Winter 2017
Due to historic and unseasonably warm rainy weather, Chicago witnessed no measurable snow cover for the entire months of January and February for the first time in records dating back to 1884. Christmas morning 2016 was the last day O'Hare International Airport reported at least an inch of snow on the ground. February has been one of Chicago's warmest on record and the city set new daily temperature records. Increasing winter temperatures are one of the clearest signals of climate change.
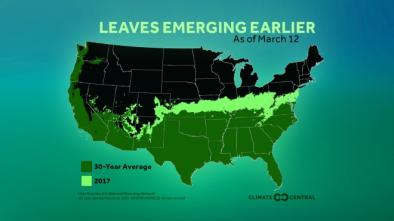
Due to global warming, winters are now warmer and the number of new record high temperatures are far outpacing new record lows. Observed long-term trends towards shorter, milder winters, decreased snow cover, and earlier spring thaws are altering the timing of critical spring events such as bud burst and emergence from overwintering.

Related Content

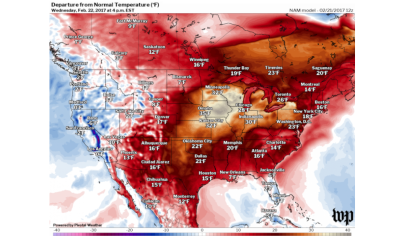
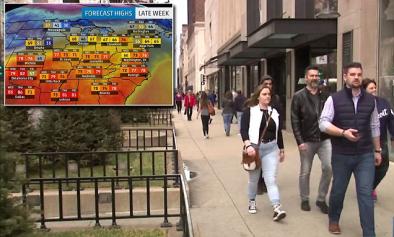
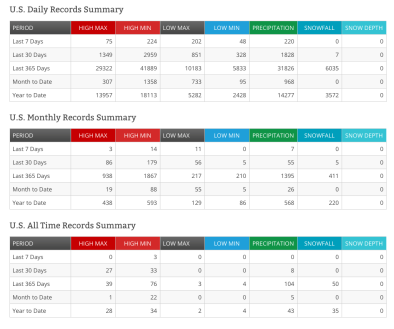
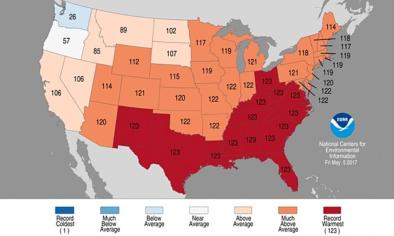
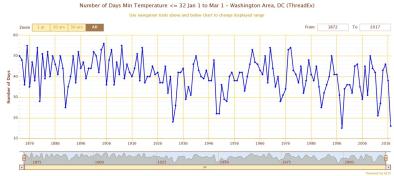
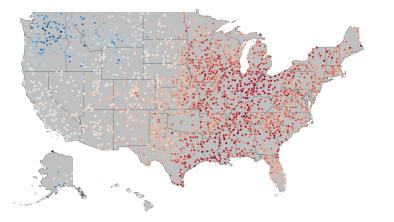
Eastern US Record Winter Heat February 2017
From February 1 through 28, the US broke 5,452 daily high maximum and 4,686 daily high minimum temperature records, compared to 213 daily low maximum and 84 daily low minimum records.[1] This means there were 34 heat records broken for every one cold record.
One of the clearest findings of climate science is that global warming has already dramatically amplified the intensity, duration and frequency of extreme heat events, including winter warm waves. In the US, increasing winter temperatures in particular are a signal of climate change. Due to global warming, the distribution of seasonal mean temperature anomalies has shifted toward higher temperatures and the range of anomalies has increased, leading to more heat records in every season. Seventy-five percent of the world's moderate heat events are now attributed to climate change.
Observed long-term trends towards shorter, milder winters and earlier spring thaws are altering the timing of critical spring events such as bud burst and emergence from overwintering.

Related Content


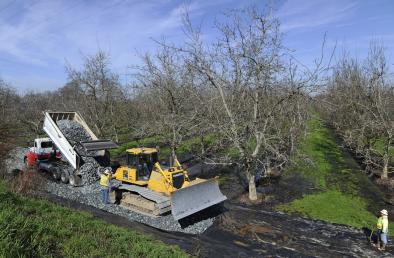
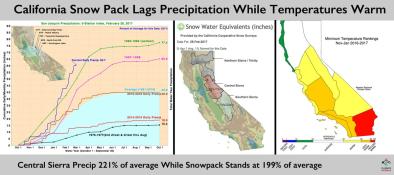
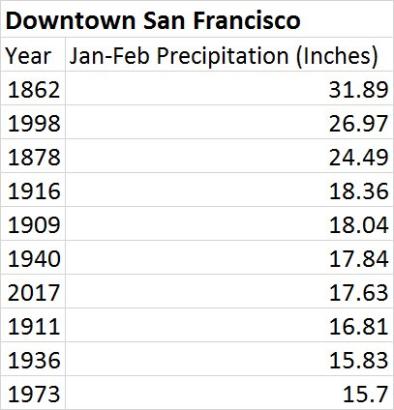
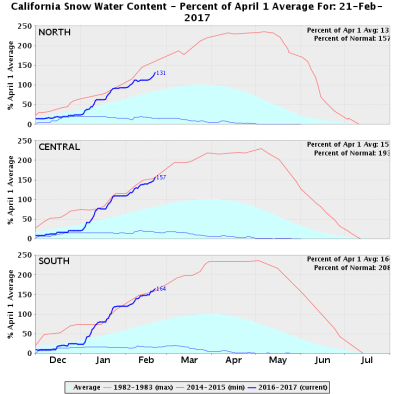
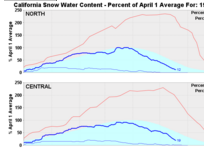
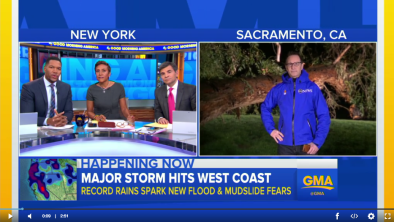
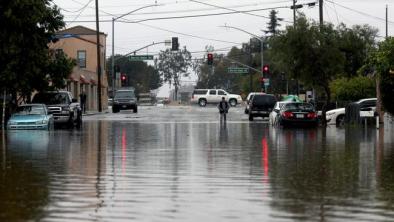
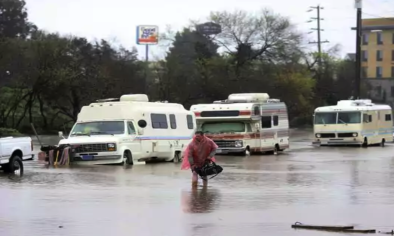
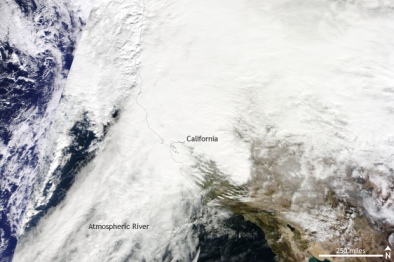
California President's Day Weekend Floods February 2017
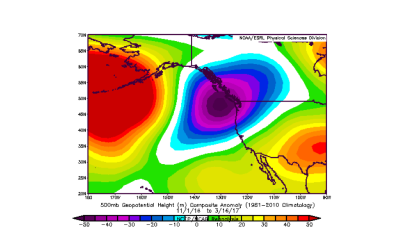
On the heels of record-breaking rainfall in January, a series of atmospheric river events brought record rainfall first to Southern and then Northern California in mid-to-late February, causing dangerous flooding, landslides and damaging winds. The winter of 2016-2017 has been one of California's wettest on record, and precipitation since January 1st has led to widespread water-related impacts.
Climate change contributes to both heavy precipitation as well as warmer temperatures that prematurely melt snow pack. The combination of heavy precipitation and snow-pack melt has driven the state from drought to flood. Natural climate variability in California is extremely high. Both drought and flood are part of the natural climate pattern. And climate change contributes to both. As California swings between drought and flood, climate change helps push the pendulum out to either extreme, furthering weather whiplash.
Related Content
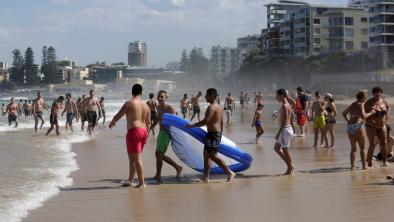
Australia Record Heat 2017
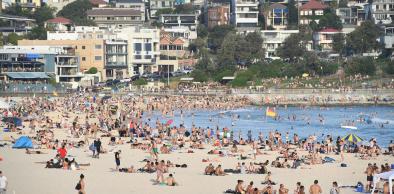
Australia kicked off 2017 with a series of record-breaking heat waves across many eastern parts of the country. The most notable feature of the extreme heat event was its persistence. The town of Moree near the Queensland border recorded 41 consecutive summer days, as of February 5, with high temperatures of 95°F (35°C) or more, smashing the previous record of 17 consecutive days in the summer of 1981-82.
The impact of global warming is clearly observed in a distribution shift of daily weather, as well as shifts in monthly and seasonal climate, to higher temperatures. In Australia, climate change has been shown to drive longer, hotter and more intense heat waves.


Related Content
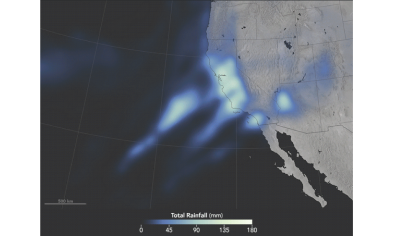
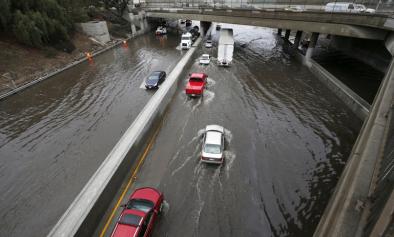
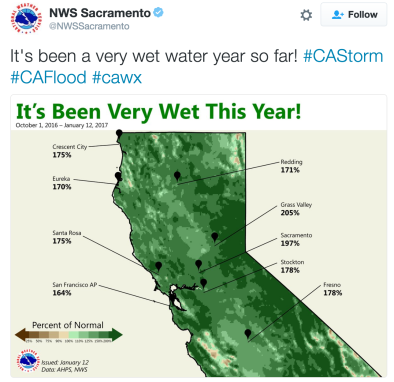
California Floods January 2017
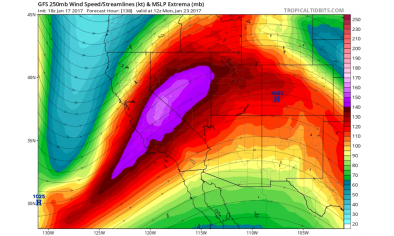
On January 3 and 4, the first of two back-to-back atmospheric river storms brought heavy rain, mountain snow, and localized flooding to central California. The second storm, fueled by a powerful, long-duration atmospheric river funneling warm and moist air from southeast of Hawaii, hit central and northern California beginning late on January 7 and pushed major rivers past flood stage levels and drove extreme gusts, leading to power outages as well as rock and mudslides. Temperatures during the second storm were warm, which pushed snow levels back above the Sierra passes and converted snowfall to rainfall, elevating flood risk. A 3rd storm dropped additional heavy rain and snowfall amounts up to 4 inches on January 10 and up to 6 inches on January 11. These storms are consistent with observed trends and projections indicating that extreme precipitation in California, as well as globally, increases generally in a warming climate. Moreover, projections indicate that the most intense atmospheric river storms in particular increase in California in a warming climate. In addition, warmer temperatures means more precipitation falls as rain rather than snow, elevating the risk of flooding. Snow levels retreat to higher elevations, diminishing snow pack and increasing runoff and flooding risk.
Related Content