Arctic Sea Ice Winter Maximum 2018
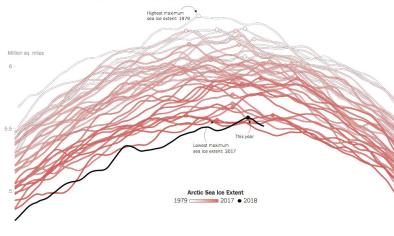
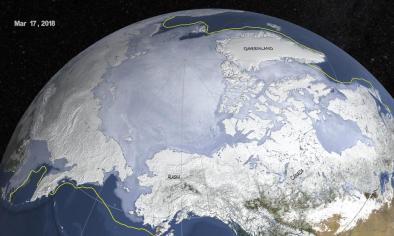
After three consecutive record lows in March of 2015, 2016 and 2017, Arctic sea ice winter maximum extent nearly set another record low this year, taking second place at 5.59 million square miles (14.48 million square kilometers).
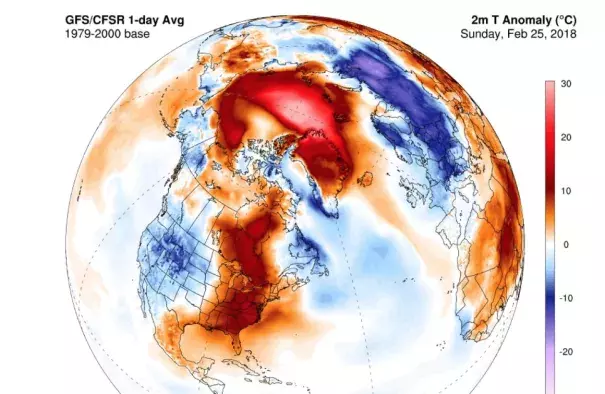
The Arctic is warming at about twice the rate of the Northern Hemisphere, largely due to anthropogenic global climate change.[2] Arctic sea ice has shown a dramatic decline since at least 1979—when satellite measurements began—due to climate change.
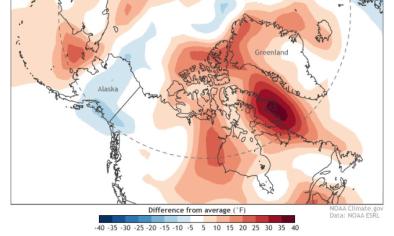
The Arctic just finished its warmest winter on record.[3] Near the North Pole, temperatures have averaged approximately 10°F (6°C) above normal since January 1.[4] The northernmost weather station in the world recorded above-freezing temperatures for over 60 hours in February.[4]
How do scientists gauge the state of Arctic sea ice?
They look at a number of different metrics and take note of long-term trends. Some key metrics are:
- Air temperatures: Scientists track daily temperatures in the region, number of freezing degree days, annual average temperature and more.
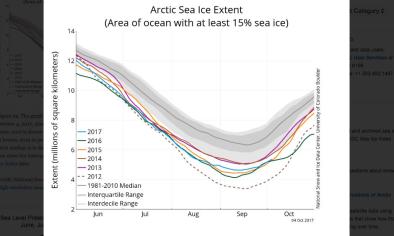
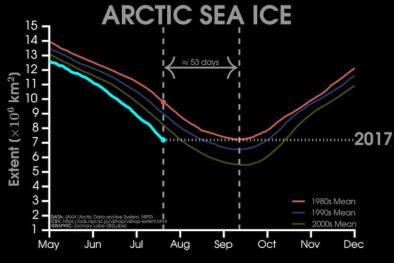
- Extent: The area of the Arctic Ocean covered by sea ice grows and shrinks each year.
- Winter maximum extent: Arctic sea ice reaches its maximum daily extent in the winter (usually sometime in March).
- Summer minimum extent: It reaches its minimum daily extent in the summer (usually sometime in September).
- Monthly average extent: Daily extent measurements can also be averaged over the course of a particular month, and compared to the same month in other years. For example, monthly average extent in February 2018 was the lowest ever recorded for a February.
- Note on Antarctic sea ice: Antarctic sea ice runs on approximately the opposite minimum/maximum extent schedule according to the Southern Hemisphere seasons.
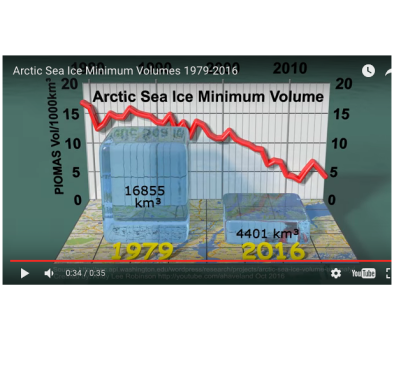
- Sea ice volume: This metric takes the thickness of sea ice into account in addition to extent. Arctic sea ice volume typically reaches its annual maximum in May. Observations of Arctic sea ice thickness are hard to come by, so volume may be calculated using models like PIOMAS.
- Late freeze-up: The later ice freezes in the Arctic Ocean, the less time it has to gain thickness over the season.[1]
Where does the data come from?
Key sources include:
- National Snow and Ice Data Center (NSIDC)
- Japan Aerospace Exploration Agency (JAXA)
- Polar Science Center
- Polar Portal
- Arctic Data archive System (ADS)
- Arctic Regional Ocean Observing System (Arctic ROOS)
Climate signal breakdown
Climate signal #1: Arctic amplification
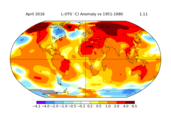
The long-term trend of global warming can be seen in the progression of annual global mean temperatures. But upon zooming in, it becomes clear that some regions are warming faster than others. This is the case for Northern Hemisphere high latitudes—including the Arctic—relative to low or middle latitudes.[2]
During the past few decades the Arctic has warmed approximately twice as rapidly as has the entire Northern Hemisphere, a phenomenon called Arctic Amplification (AA).[3] This widespread warming is due to a combination of increased greenhouse gases and feedback loops involving sea ice, snow, water vapor, and clouds that further enhance warming.[3]
Even a small shift in climate leads to a dramatic increase in the frequency of extreme temperatures. For the Arctic, "extreme" warm temperatures may be cold by other regions' standards, but they nevertheless put sea ice at risk.
Observations consistent with the Arctic amplification signal
2018 has already been marked by bizarre warmth in the Arctic.
- The Arctic experienced its warmest winter on record this year.
- North of 80° latitude, temperatures have averaged approximately 10°F (6°C) above normal since January 1.[4]
- The northernmost weather station in the world, Greenland's Cape Morris Jesup, recorded above-freezing temperatures for over 60 hours in February.[4][5]
Climate signal #2: Decreased Arctic sea ice
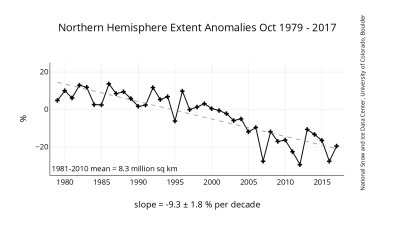
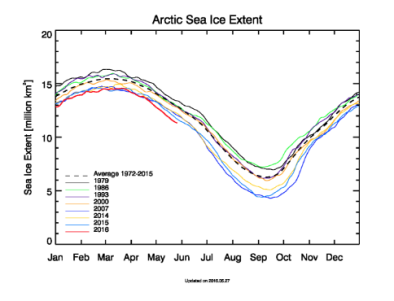
Arctic sea ice has been in decline since at least 1979—when satellite measurements began—due to climate change, and the thinning is accelerating.
The decline has been greatest during summer, for which the rate of decrease of ice extent since 1979 has been approximately 12 percent per decade.[6] Summer sea ice in September thinned 85 percent (from 9.8 feet to 1.4 feet, or 3 to 0.43 m) between 1975 and 2012.[7] The area of summer sea ice lost since the 1980s would cover over 40 percent of the contiguous United States.[3]
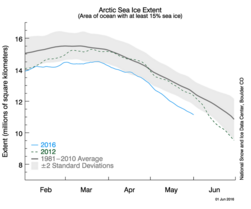
Before 2007, the summer minimum extent had never fallen below 1.93m sq mi (5m sq km). From 2007 to 2017, this threshold was crossed eight out of 11 years.[8] The all-time record low summer minimum sea ice extent occurred in 2012 at 1.4m sq mi (3.63m sq km).[8]
Factors contributing to the rapid ice loss of the past decade include warming air temperatures, changes in the amount of the sun's energy that Earth absorbs, changes in air circulation, and changes in the amount of heat transferred in the ocean that affect sea ice from below.[6]
Observations consistent with the decreased Arctic sea ice signal
- Summer minimum extent occurred on September 13, 2017.[9] It was the 8th lowest summer minimum extent in the satellite record.[9] An NSIDC scientist, commenting on the low extent in 2017, stated that the year's sea ice minimum indicated the long-term downward trend has continued with sea ice extent falling below 1.93m sq mi (5m sq km).[10]
- The last four years have brought the four smallest winter maximum extents in the 39-year satellite record.[11] Winter maximum extent set three consecutive record lows in 2015, 2016 and 2017. This year, it nearly set another record low, taking second place at 5.59 million square miles (14.48 million square kilometers) on March 17.[11]
- Monthly average extent in February 2018 was the lowest ever recorded for a February.[1]
The state of Antarctic sea ice
At the opposite pole, Antarctica already saw a near record-low summer sea ice minimum this year.[12] Sea ice extent reached its daily seasonal minimum on February 20 and 21, 2018.[1] It measured 842,000 square miles (2.18 million square kilometers),[1] making this year's minimum the second-lowest in the satellite record.[1] 2017's minimum was the lowest on record.[1]
Related Content