Chicago Heat Wave 1995
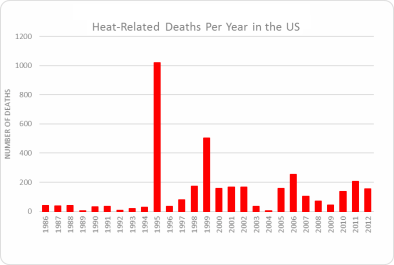
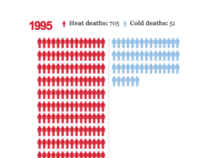
Between July 12 and July 20 of 1995, an unusually hot and humid air mass settled over the upper Midwest region of the US, causing thousands of Chicago residents to fall ill, power transformers to fail, ambulance services and hospitals to become overwhelmed, and 739 people to die.[2][3][4] One of the clearest findings of climate science is that global warming amplifies the intensity, duration and frequency of extreme heat events.[5][6]


Climate science at a glance
- The severity of the Chicago heat wave was due to extreme high and low daily temperatures, high humidity, and the urban heat island effect, all of which are increasing due to global warming.
- High humidity and overnight temperatures made it difficult for people to find relief and intensified the heat wave's human impact. Warmer nighttime temperatures and more humid heat events are classic signals of climate change.[1][2]
- Black people were 1.5 times more likely to die than Whites and people 65 years of age and older accounted for 72 percent of all deaths.
- Since 1986, Chicago low temperatures have been above normal most years, often outpacing the country as a whole by a wide margin.
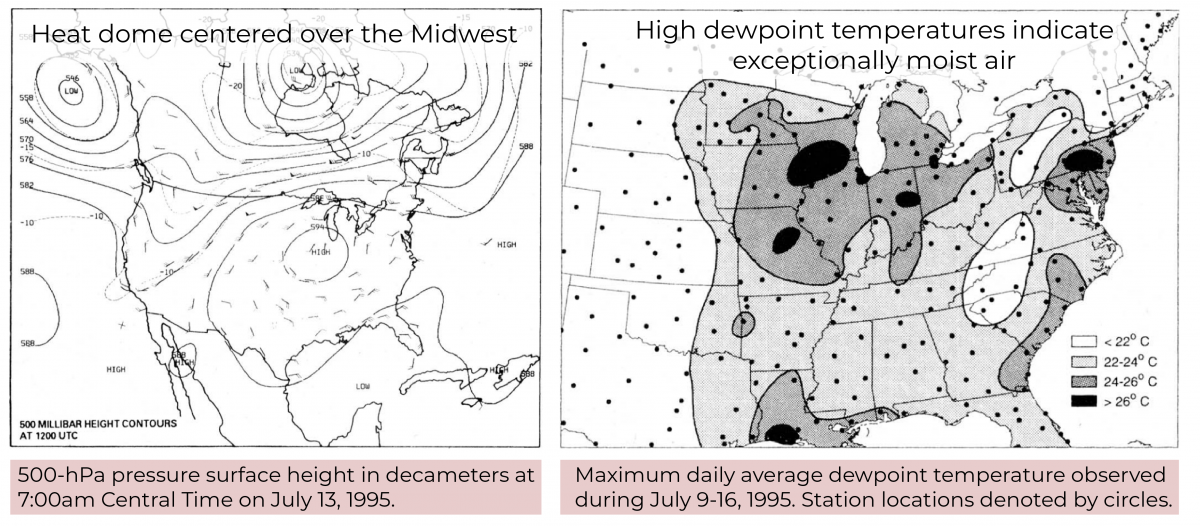
- Models predicted and observations indicate that climate change intensifies the atmospheric pattern (sometimes referred to as a "heat dome") underlying the Chicago heat wave.
- By 2100, 1995-like heat waves could occur every other year on average under lower emissions scenarios and as frequently as three times per year under higher.[3]
Background
What caused the Chicago heat wave?
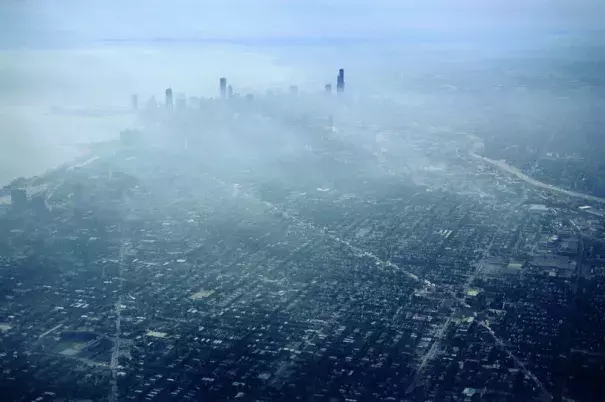
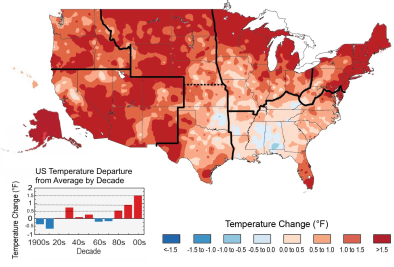
July 12-15, 1995, was dominated by an unseasonably hot and humid air mass that was slow to move out of the Midwest. An abnormal upper-level ridge and a dome of high pressure controlled the overall weather pattern that fateful week in July. Typically, upper-level ridging is associated with warmer temperatures beneath the ridge. On the evening of July 13, 1995 the upper-level ridge was centered over the upper Midwest. The resulting surface temperatures during the event were 10-20°F above average.
How unusual was the Chicago heat wave?
The 1995 Chicago heat wave represents the 17th worst US disaster on record of any kind in terms of overall fatalities. The event was the most intense short-duration heat wave in about 50 years at many locations in the southern Great Lakes region and Upper Mississippi River Basin. For two days, the minimum temperature failed to go below 89°F (31.5°C), an event so rare it has a probability of occurring only once every 1,000 years.[4]
What communities were most impacted?
Over the course of five days, 739 excess deaths were recorded, with elderly, low-income, and Black communities disproportionately affected. Black people were disproportionately represented in the heat statistics and were 1.5 times more likely to die than White people. People 65 years of age and older accounted for 72 percent of all deaths, consistent with research showing that more than 80 percent of heat’s victims generally are over 60. Societal vulnerability is a major factor in the determination of who experiences the most severe impacts of extreme heat, with access to cooling being one of the most important factors in determining household-level adaptive capacity.
If it’s going to be too hot to work outside, we know who’s going to be affected. If we’re talking about urban heat islands, we know who can’t afford to run their air-conditioners 24/7. Climate change is more than parts per million and greenhouse gases. The people who are feeling the worst impacts of climate, their voices have got to be heard.
- Dr. Robert Bullard, Texas Southern University, often called the father of environmental justice
Climate signals breakdown
Climate signal #1: Extreme heat and heat waves
The clearest signal of climate change is the increase in the frequency and intensity of extreme heat events. As greenhouse gas emissions trap additional heat close to the Earth's surface, temperatures that were once rare become commonplace and the likelihood of seeing extreme and record-hot temperatures increases.
Observations consistent with climate signal #1
-
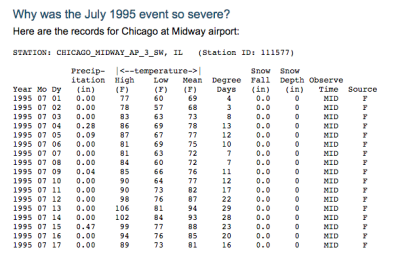
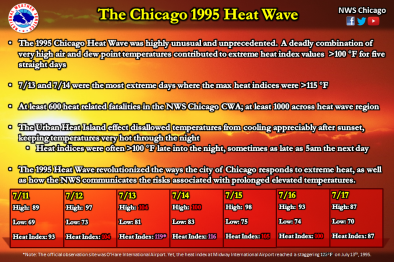
Highest temperature recorded for any Chicago area reporting station during this event was 106°F at Midway Airport on July 13th. The only other documented higher temperature at any Chicago site on record was 109° at Midway Airport during the Dust Bowl in 1934.
-
Surface temperatures were 10-20°F above average.
-
One study estimates that extreme high temperatures like those observed in the 1995 heat wave are likely to occur once every 23 years (what is known as a 23-year return period).[4]
-
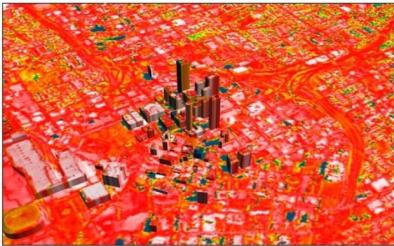
The urban heat island effect is estimated to have exacerbated the impacts in Chicago by raising nighttime temperatures more than 2°C.[5]
Climate signal #2: Humidity and Heat Stress Increase
Extreme heat events have long threatened public health in the United States, and the risk to human health is understandably amplified as globally averaged temperatures increase.[6][7][8] The dramatic increase in nighttime temperatures in the US is particularly concerning, because cooler nighttime temperatures provide an important window of relief during heat waves.[2] Deaths result from heat stroke and related conditions, but also from cardiovascular disease, respiratory disease, and cerebrovascular disease.[9] Heat waves are also associated with increased hospital admissions for cardiovascular, kidney, and respiratory disorders.
Heat is especially dangerous with high humidity, because it reduces the human body's ability to cool off by sweating. The Heat Index, also known as the "real feel" temperature, is a measure of how hot it really feels when relative humidity is factored in with the actual air temperature. As air warms, its capacity to hold water vapor increases, and measurements show that atmospheric humidity is increasing around the globe.[8] In the US, humid heat extremes doubled in frequency from 1980-1999 to 2000-2019 in most regions.[1]
Observations consistent with climate signal #2
-
Incredibly high dew points were observed (near or above 80°), and the combination of temperatures and dew points resulting in a peak heat index of 124-125°F.
-
For a period of 48 hours, the minimum temperature failed to go below 89°F (31.5°C).[4]
Related Content