Midwest and Eastern Heat Wave July 2019
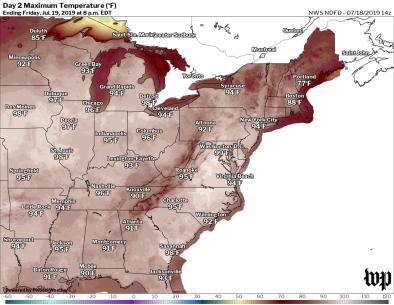
Intense July sun combined with a northward retreat of the jet stream and the invasion of humid air from the south sent temperatures soaring 10 to 20°F above normal across the Central and Eastern US during what is already the hottest time of year. Maximum heat indices on July 20 reached 110 to 114°F across a wide swath of the eastern Mid-Atlantic.[1] The widespread triple-digit indices continued through Sunday and resulted in the highest US electricity demand since 2017.[2][3]
Extreme, record-breaking heat is among the most obvious and well documented effects of climate change. Less than one month prior to this event, rapid climate change analysis found the record-smashing heat wave in Europe was at least five times more likely due to climate change.[4] The fingerprint of climate change has also been identified in many recent extreme heat events in the United States.
Climate change is also thought to increase the frequency of large scale atmospheric pressure patterns with little or no movement—referred to as atmospheric blocking—that lead to extreme heat waves.


Climate science at a glance
- The fingerprint of global warming has been firmly identified in the increasing intensity, duration and frequency of extreme heat events in the United States.[1][2][3][4][5][6][7]
- A June 2016 study found an increase in the intensity of heat domes over the entire Northern Hemisphere during the summer months from 1979 to 2010.[8]
- There has been a dramatic increase in hot nighttime temperatures in the US, reducing the number of critically important relief windows during heat waves.[9]
- Challenges to human health are growing due to the increased frequency and intensity of high temperature extremes that cause heat stress.[10]
- As air warms, its capacity to hold water vapor increases, and measurements show that atmospheric humidity is increasing around the globe, consistent with a warming climate.[10]
- The fingerprint of climate change has been found in the increase of wet bulb temperature since 1973, driving heat stress globally.[11]
- Atmospheric blocking due to anomalous, persistent, meandering of the jet stream often causes weather extremes in the mid-latitudes.[12]
Background information
Global warming leads to more heat waves and record temperatures
In a warming climate, extreme cold temperatures decrease precipitously, while extreme hot temperatures increase dramatically. In a stable climate, the ratio of days that are record hot to days that are record cold is approximately even. However, in our warming climate, record highs have begun to outpace record lows, with the imbalance growing for the past three decades.[13]
Changes in atmospheric circulation patterns affect temperature
Global warming is altering the pattern of atmospheric circulation (e.g. the jet stream), and some of these global changes are dramatically amplifying local heat extremes. Waves in the jet stream are stalling in place, as opposed to moving eastward, leading to blocking and persistent weather patterns that fuel the intensity and duration of heat waves. A video explainer is here.
Heat domes are a type of atmospheric blocking event
Atmospheric blocking events in the summer that cause extreme and prolonged heat are sometimes called "heat domes." This is not a scientific label, but can be used to describe sprawling high-pressure systems in the mid- to upper atmosphere that push warming air to the surface and hold it there. Experts don't agree on how apt the metaphor really is.
A June 2016 study found an increase in the intensity of heat domes over the entire Northern Hemisphere during the summer months from 1979 to 2010.[8]
Climate signals breakdown
Climate signal #1: Extreme heat and heat waves
The climate has shifted significantly, leading to more heat records in every season. The number of local record-breaking average monthly temperature extremes worldwide is now on average five times larger than expected in a climate with no long-term warming.[14] The trend in global warming has contributed to the severity and probability of 82 percent of record-hot days globally.[5]
The National Academy of Sciences reports and validates numerous studies as well as two major science assessment reviews that definitively identify the fingerprint of human influence in driving the changes observed to date.
Observations consistent with climate signal #1
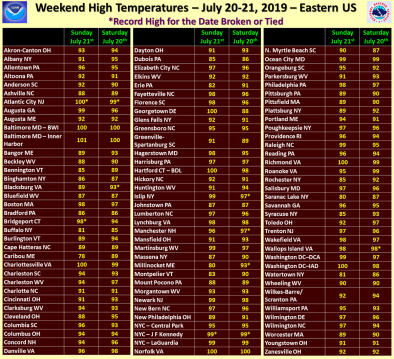
- On July 20, new one-day temperature records were recorded in at least half a dozen places, including a high of 99°F (37.2°C) in New York where power failures were reported and a high of 97°F (36.1°C) in Detroit.[15]
- Maximum heat indices on July 20 reached 110 to 114°F across a wide swath of the eastern Mid-Atlantic.[16]
Climate signal #2: Humidity and Heat Stress Increase
Exposure to extreme heat is already a significant public health problem and the primary cause of weather-related mortality in the US.[17] As temperatures continue to increase due to climate change, heat stress is expected to worsen.
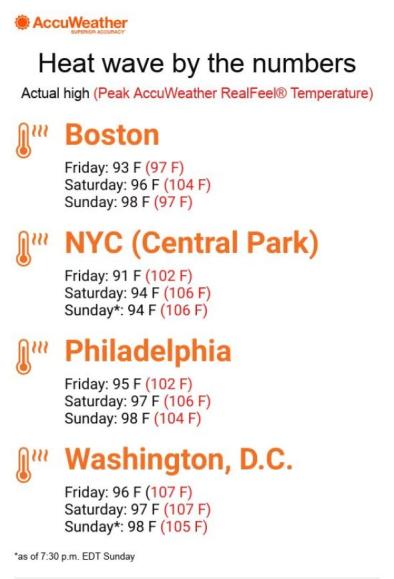
The atmosphere can also hold more water, reducing our bodies’ ability to cool off and increasing our risk of heat-related illness. The Heat Index, also known as the "real feel" temperature, is a measure of how hot it really feels when relative humidity is factored in with the actual air temperature.
Observations consistent with climate signal #2
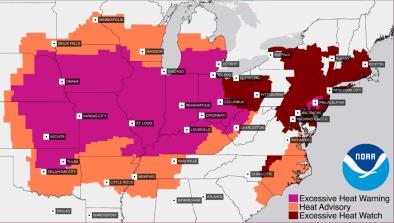
- About 128 million people were under excessive-heat warnings on Saturday, and 72 million people again on Sunday.
- Six heat-related deaths have been reported.[18]
- In Arkansas, former New York Giants offensive lineman Mitch Petrus died after being struck by heat stroke.[19]
- The mayors of Boston, New York City, Philadelphia and Washington, D.C., declared heat emergencies. New York City and Baltimore issued Code Red Extreme Heat Alerts.[19]
- In New York City, emergency medical workers and firefighters faced a surge in calls during the weekend’s extreme heat, city officials said. Calls for emergency medical services typically range between 4,000 and 4,500 on any day. On Friday, calls reached 4,606, and they soared to 5,143 on Saturday. As of noon Sunday, the city received 2,191 emergency calls.[20]
- On a typical summer night, electricity demand for the Lower 48 states is usually lower than 400 GW, but during the heat wave, nighttime electricity demand remained between 430 GW and 450 GW.[21]
Climate signal #3: Atmospheric blocking increase
The jet stream has a limited capacity for changes in wave activity (a measure of meandering), and when it is exceeded, blocking manifests as congestion. This is similar to how the highway has a limited capacity for traffic that, once exceeded, causes congestion. Climate change is thought to increase blocking frequency by increasing changes in wave activity that exceeds the jet stream’s capacity.[12]
A June 2016 study found an increase in the intensity of heat domes over the entire Northern Hemisphere during the summer months from 1979 to 2010.[8] An earlier study identified an increase in blocking duration year-round over the Northern Hemisphere since about 1990.[22]
Observations consistent with climate signal #3
- The trigger for this heat wave is a sprawling, strong high pressure area, also known as a "heat dome," building across the US. Heat domes are atmospheric blocking events in the summer that cause extreme and prolonged heat.[23]
Related Content