Decade in review: how climate change has made hurricanes worse
A decade of extremes shows climate change is already increasing the dangers posed by hurricanes in far more ways than previously thought
The Earth is running a fever, and a decade of extreme events has made clear how a little shift in global temperature can lead to big impacts. The global surface temperature on Earth was 58.4°F on average each year from 2010 to 2018. This is 1.4°F above the 20th century average of 57.0°F, making it the hottest decade on record by far.
To crystallize the consequences of global warming, Climate Signals is sending a series of decadal reviews during December summarizing climate science advances and highlighting major US impacts that are symptomatic of climate change.
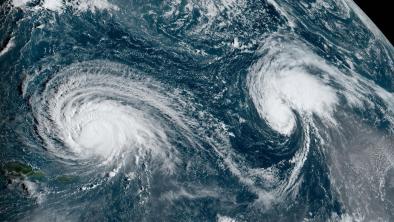
This week, having just reached the end of the 2019 Atlantic hurricane season, the focus is tropical cyclones.
In the US, half – five out of ten – of the costliest tropical cyclones on record occurred over the past decade. Between 1980 and 2013, the US averaged six billion dollar disasters a year. Over the most recent five years, that number has jumped to more than 12 billion dollar disasters a year.
During the past decade:
- The record for the strongest tropical cyclone in terms of wind speed was broken twice: by Haiyan in 2013 and by Patricia in 2015.
- 2019 is the fourth year in a row that the Atlantic basin has had at least one hurricane reach Category 5 strength. That's the most consecutive years on record with at least one Category 5 in the Atlantic, topping a three-year stretch from 2003 to 2005.
- The US experienced its costliest extreme weather year on record in 2017. The damage from Hurricanes Harvey, Irma and Maria alone are responsible for approximately $265.0 billion of the $306.2 billion total damage done that year.
- The years 2011 and 2017 had 16 billion-dollar disasters and are tied for the highest number of billion-dollar disasters for a single year.
- Studies have shown that climate change increased precipitation during Hurricanes Sandy, Harvey, Maria and Irma.
- Studies have shown that climate change increased the intensity of entire hurricane seasons in the Pacific and Northwest Atlantic.
SCIENTIFIC ADVANCES
Certainty that climate change is intensifying hurricanes has increased.
Looking at all the evidence, most scientists agree that global warming has increased the average intensity of the strongest hurricanes since the early 1980s. They also agree that global warming has increased the relative number of hurricanes reaching Category 4 or 5 intensity (Knutson et al. 2019). In 2016, the direct influence of anthropogenic climate change was clearly identified in connection to increased cyclone intensity (Zhang et al. 2017).
Climate models accurately predicted observed hurricane intensification.
Atlantic hurricanes during the past decade have intensified at the rate anticipated in a 2008 study due to increases in sea surface temperature. (Elsner et al. 2008; recent analysis here)
I co-authored a paper in 2008 showing that hurricanes strengthened from 1981 to 2006 at a rate of .63 m/s/yr (or 1.41 mph/yr). This trend has continued during the 13 years since, and it is due, in all likelihood, to a corresponding rise in ocean temperatures.
— James Elsner, professor and chair of Geography at Florida State University
There has been an increase in the number of climate change attribution studies on hurricane impacts in the United States.
Following record rainfall during Hurricane Harvey, a series of four attribution studies identified the fingerprint of climate change in Harvey’s extreme precipitation (Wang et al. 2018; Risser and Wehner, 2017; Van Oldenborgh et al. 2017; Emanuel, 2017), and two studies in 2018 attributed the record high sea surface temperatures that sustained and intensified Harvey’s rainfall to climate change (Trenberth et al. 2018; Wang et al. 2018).
In September 2018, Reed et al. (2018) published a first-of-its-kind experimental “pre-attribution” study done as Hurricane Florence was approaching landfall. The study found that Florence’s most intense rains over North Carolina were more than 50 percent greater in magnitude and Florence’s areal size 8 to 9 percent greater due to climate change.
Global warming has directly affected not just individual hurricanes, but entire hurricane seasons.
Scientists linked the intensity of the 2015 western North Pacific season to global warming (Murakami et al. 2016a; Zhang et al. 2017), as well as the extremely active 2014 and 2015 Central Pacific hurricane seasons (Murakami et al. 2016b).
Scientists can pinpoint the effect that climate change has on hurricane rainfall.
For example, five studies found that climate change made Hurricane Harvey’s rainfall worse by as much as 38 percent (Trenberth et al. 2018; Wang et al. 2018; Risser and Wehner, 2017; Van Oldenborgh et al. 2017; Emanuel, 2017). Climate change also increased the rainfall rates for Hurricanes Sandy (Trenberth et al. 2015), Maria, and Irma (Patricola and Wehner, 2018).
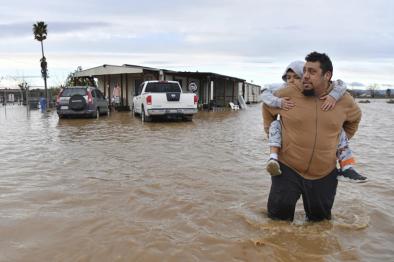
Climate change is linked to slower moving hurricanes that dump more rain.
Sluggish hurricanes have become increasingly common over the past 70 years, bringing more rain and causing more damage than ones that pass quickly. (Kossin 2018) This is consistent with modeling studies showing that warming temperatures due to climate change lead to slower storms. (Gutmann et al. 2018)
In the past decade, it was discovered that hurricanes may be moving slower in some places, which could cause more flooding problems as heavy rainbands will sit for long periods of time. Examples of storms like this in the past decade are Harvey and Florence.
— Kelsey Ellis, physical geographer at the University of Tennessee
NOTABLE IMPACTS
2012: HURRICANE SANDY
- At 940 millibars, Sandy was the most intense hurricane on record to make landfall north of Cape Hatteras, consistent with the poleward expansion of the zone for strong hurricanes.
- Waters off the Northeastern coast, where Sandy strengthened before veering northwestward toward New Jersey, were 5.4°F (3.0°C) above average.
- Sandy cost $73.5 billion, and at the time, it was the second costliest Atlantic Hurricane in history behind Katrina. It is now the fourth, after Hurricanes Katrina ($168.8 billion), Harvey ($130.0 billion), and Maria ($93.6 billion).
2015: HURRICANE PATRICIA & THE NORTH PACIFIC SEASON
- On Friday, October 23, 2015, Hurricane Patricia reached a top wind speed of 201 mph becoming the most intense cyclone ever recorded.
- Scientists have linked the intensity of the 2015 Pacific season to global warming. It was the second-most active Pacific hurricane season on record.
2017: HURRICANES HARVEY, MARIA, & IRMA
- Hurricane Harvey set a new national tropical cyclone rainfall record of 60.58 inches near Nederland, Texas.
- Hurricane Irma maintained maximum Category 5 wind speeds of at least 180 mph for 37 hours, longer than any storm on Earth on record.
- Hurricane Maria’s minimum central pressure of 908 mb is the lowest pressure on record of any hurricane in the Atlantic basin east of 70°W, and broke the record that had been set just a couple of weeks earlier by Irma of 914 mb.
2018: HURRICANE LANE & THE CENTRAL PACIFIC SEASON
- With 52.02 inches of rain measured at one gauge on the Big Island, Lane was the second-wettest tropical cyclone ever recorded in the U.S., after Harvey.
- It was only the 6th recorded Category 5 hurricane in this part of the Pacific and the nearest to Hawaii a Category 5 hurricane has ever been observed.
2019: HURRICANE DORIAN
- Hurricane Dorian’s peak winds increased from about 150 mphto 185 mph in nine hours — a rate of intensification never before observed for a storm this strong.
- Hurricane Dorian’s 185 mph sustained wind at landfall in the northwest Bahamas tied for the strongest winds at landfall on record in the Atlantic Ocean.
RESOURCES (Feel free to use)
[INFOGRAPHIC] Category 4 and 5 U.S. hurricane landfalls in 2017, 2018, and 2019
[VIDEO] Climate change and hurricanes (part 1)
[VIDEO] Climate change and hurricanes (part 2)
[GIF] Hurricane Power Tracking with Sea Temperatures (1949 - 2000)
Related Content