Continental US Heat Wave July 2020
A sprawling and stagnant heat dome caused extreme and record-breaking heat across much of the US in mid-July, with temperatures 5 to 20°F above average during what is typically the hottest time of year for many states. Record-breaking heat waves are a classic signal of climate change, and the stagnant weather pattern intensifying the heat wave is also expected to increase with climate change. Heat records don't last long these days, as the Earth continues to warm due to rising greenhouse gas emissions. The US has experienced record breaking heat every summer in recent years, and the past six years globally were also the six hottest on record. 2020 has been the planet’s 2nd hottest year on record through June and is 90 percent likely to finish among the top three.

Climate science at a glance
- The fingerprint of global warming has been firmly identified in the increasing intensity, duration and frequency of extreme heat events in the United States.[1][2][3][4][5][6][7]
- In most US regions, humid heat extremes doubled in frequency from 1980-1999 to 2000-2019.[8]
- The fingerprint of climate change has been found in the increase of wet bulb temperature since 1973, driving heat stress globally.[9]
- There has been a dramatic increase in hot nighttime temperatures in the US, reducing the number of critically important relief windows during heat waves.[10]
- For the period 2004-2018, Indigenous communities had the highest rate of heat-related deaths and Black communities had the second-highest.[11]
- Global warming contributed to the record for hottest day of the year in at least 82 percent of the records for hottest day over the 1961-2010 period.[5]
- Heat domes increased in intensity over the entire Northern Hemisphere during the summer months from 1979 to 2010.[12]
Background information
How does extreme heat intersect with the coronavirus pandemic?
 Extreme heat and COVID-19 create a vicious cycle. The impact of extreme heat on vulnerable populations compounds the dangers posed by the coronavirus pandemic. The heat wave is most intense along the US southern border from California to Florida, an area which has seen some of the worst outbreaks of COVID-19. Arizona and Texas are both seeing record numbers of new infections. The influx of COVID-19 patients, and the precautions taken to limit the spread of the virus, lower hospitals' ability to handle heat stroke and other heat-exacerbated cases.
Meanwhile, the extreme heat forces people unable to afford housing or air conditioning into cooling centers, where social distancing is difficult and they can be exposed to the virus. Communities of color have been hit hardest by a number of factors: COVID-19, poverty, poor housing, polluted water, isolation and other harms resulting from systemic racism. These factors, along with a lack of running water caused in part by coal extraction, has made the Navajo Nation one of the epicenters of the pandemic.
The situation in El Centro, California is another powerful example of the intersection of social inequity, the COVID-19 pandemic and climate change during the heat wave. It is a rural, majority Latino community, and by mid-July, the city had endured several weeks of extremely hot conditions. One in four people in El Centro live below the poverty line, and unemployment rates are significantly above the rest of the country, according to El Centro Mayor Efrain Silva. The county has three times the number of infections per capita than Los Angeles, and its COVID death rate is nearly twice that of any other California county. The virus is exposing underlying problems, says Luis Olmedo of Comité Cívico del Valle, a grassroots justice organization in the Imperial Valley. “We are the poster [child] of those inequities and the reason why we’re not able to control COVID.”
What are high pressure systems and heat domes?
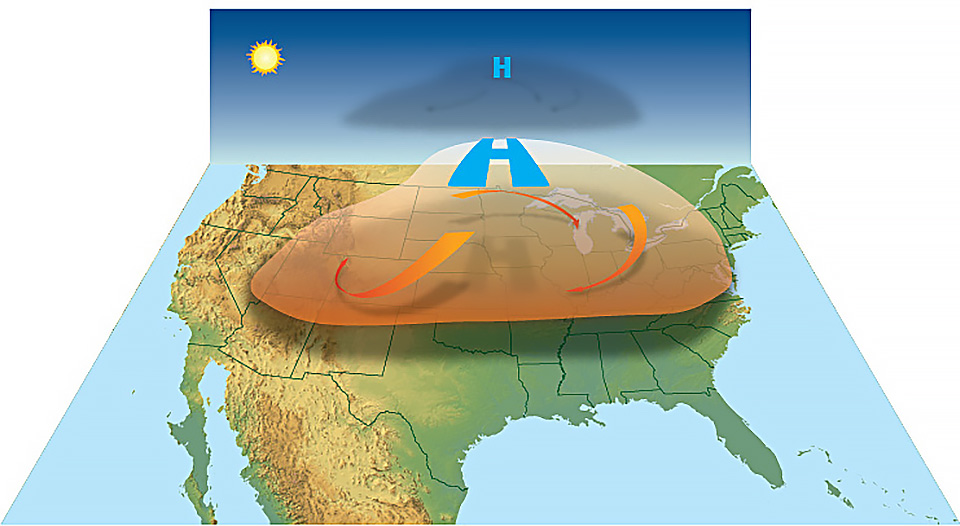
The widespread and intense heat wave was due to a stagnant high pressure weather pattern, or heat dome, that has halted the west-to-east movement of weather and created a vast area of sweltering heat that is trapped under the high-pressure "dome." But what does this mean?
Let's first take a look at pressure. The gases in the air have weight and exert pressure at the Earth's surface. At lower elevations, such as coastal regions, the total weight of the air above is greater than if you were high up on top of a mountain. Air pressure at a given location also depends on the weather. A high pressure weather pattern has higher pressure than the areas around it, meaning air molecules are more densely packed and exerting more pressure due to their weight. When a high pressure system develops, the air converges, sinks and compresses as more air piles on top. Molecules in the dense, compressed air move more rapidly, causing temperatures in the lower atmosphere to heat up.
 The piling up of dense, hot air can take the shape of a dome (shown to the right), leading to the description of some large, high-pressure weather systems as "heat domes". This is not a scientific label, and not all experts agree that it's an apt metaphor, but it is used to describe sprawling high-pressure systems that push warming air to the surface and hold it there. A June 2016 study found an increase in the intensity of heat domes over the entire Northern Hemisphere during the summer months from 1979 to 2010.[12]
Heat domes often form what are known as blocking patterns in the atmosphere, which halt the west-to-east movement of weather, causing weather conditions to persist for long periods. Atmospheric blocking due to anomalous, persistent, meandering of the jet stream often causes weather extremes in the mid-latitudes.[13]
Climate signals breakdown
Climate signal #1: Extreme heat and heat waves
The clearest signal of climate change is the increase in the frequency and intensity of extreme heat events. As greenhouse gas emissions trap additional heat close to the Earth's surface, temperatures that were once rare become commonplace and the likelihood of seeing extreme and record-hot temperatures increases. The continued burning of fossil fuels and increasing greenhouse gas emissions means that heat records don't last long as warming continues. The US has experienced record breaking heat every summer in recent years, and the six hottest years on record globally all occurred during the past six years.
The number of local record-breaking average monthly temperature extremes worldwide is now on average five times larger than expected in a climate with no long-term warming.[14] The trend in global warming has contributed to the severity and probability of 82 percent of record-hot days globally.[5]
Observations consistent with climate signal #1
- The official weather observing station in Death Valley, California reached a scorching 128°F on July 12. That is the hottest temperature anywhere on the planet since 2017 and only one degree behind what experts say is likely the hottest temperature ever recorded on Earth.
- Phoenix tied its record for the longest stretch of time where temperatures never fell below 90°F. The temperature was 90 or above for seven straight days, even at night, between July 7 and July 15.
- There were daily, monthly, and all-time records broken in California, Arizona, New Mexico, Texas, Wyoming, and Utah, as shown in the image below.
Climate signal #2: Humidity and Heat Stress Increase
Exposure to extreme heat is already a significant public health problem and the primary cause of weather-related mortality in the US.[15] As temperatures rise due to global warming, people's exposure to extreme heat conditions increases.[16] The dramatic increase in nighttime temperatures in the US is particularly concerning, because cooler nighttime temperatures provide an important window of relief during heat waves.[10]
Heat is especially dangerous with high humidity, because it reduces the human body's ability to cool off by sweating. The Heat Index, also known as the "real feel" temperature, is a measure of how hot it really feels when relative humidity is factored in with the actual air temperature. As air warms, its capacity to hold water vapor increases, and measurements show that atmospheric humidity is increasing around the globe.[16] In the US, humid heat extremes doubled in frequency from 1980-1999 to 2000-2019 in most regions.[8]
Observations consistent with climate signal #2
- On July 12, heat index ("feels like") numbers in Oklahoma and Louisiana reached near 120°F in Oklahoma and Louisiana. In New Orleans, the heat index in the middle of the night was a sweltering 107 degrees.
Related Content


