Decade in review: how climate change has made extreme heat events worse

Did you feel that? How could you miss it? Over the last decade, heat dominated extreme weather. We’ve seen record-breaking highs, but most notably, we’ve seen record-breaking lows. Nighttime temperatures often provide us relief from daytime heat, with an increase of record-high “low” temps, but people are no longer catching a break from the heat.
This comes as no surprise as climate scientists have known for decades how things were likely to play out. Richard Alley, PhD, Department of Geosciences Penn State explains, “Model projections of warming have been remarkably accurate—earlier climate modelers really did get it right.”
Heat is the clearest signal of climate change and is responsible for 1,300 deaths in the US each year. It’s also related to many heat-related illnesses including: heat stroke, heat exhaustion, heat cramps, dehydration and kidney failure.
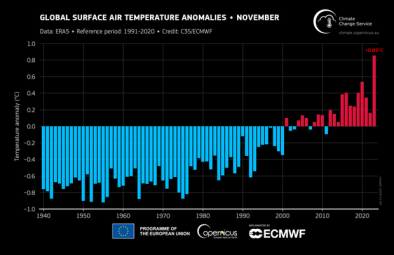
This year is set to be one of the hottest years on record, capping off the hottest decade on record.

Below, you’ll find how the latest climate science has grown over the last 10 years. .
Miss our last end of decade backgrounders? Check out how climate change amplifies tropical cyclones and floods have worsened and the science has strengthened.
The signal of human-caused climate change doesn’t get any clearer than this. Heat records toppled during the 2010s -- the first decade of indisputable climate disruption.
For the first time in recorded history the Earth broke its maximum annual average temperature record three years in a row in 2014, 2015 and 2016. While 2016 remains the record holder, the three years since are now among the top five hottest years on record. Looking at the entire decade, only the years 2011 and 2012 are not among the top ten hottest years on record.
Human-caused climate change has influenced almost all indices of temperature extremes since the 1950s and has led to changes in the frequency and intensity of extremes on a nearly global scale.[1]
HIGHLIGHTS FROM THE HOTTEST DECADE ON RECORD:
- The four hottest years in US history occurred during the 2010s. 2012 was the hottest, followed by 2016, 2017, and 2015. At the time, 2010 was the hottest year on record. That record was then broken again in 2014, and then shattered in 2015 and 2016.
- July 2019 was the warmest month on Earth since at least 1850.
- In July 2016, Mitribah, Kuwait reached 54°C (129.2°F). This is the highest temperature ever recorded in the Eastern Hemisphere and on the planet outside of Death Valley.
- Temperatures for the years from 2010 to 2019 were about 1.8°F (1.0°C) above the average for the pre-industrial period.
- 2019 is shaping up to be the second hottest year on record, about 1.7°F (0.94°C) above the long-term average.
RESOURCES (feel free to use)
- [GIF] 2010-2019: The Hottest Decade on Record
- [VIDEO] Extreme Heat and Climate Change
- [GRAPH] Hot Days and Hot Nights Increasing in the United States
- [GRAPHIC] Ratio of Record High to Record Low Temperatures July 2019
- [BACKGROUND] Extreme Heat and Heat Waves
- [BACKGROUND] Global Warming
SCIENTIFIC ADVANCES
Humans have caused 100 percent of observed warming since the 1950s.
The Fourth National Climate Assessment found that the likely range of human contribution to the global mean temperature increase over the period 1951–2010 is 1.1° to 1.4°F. This translates to a likely human contribution of 93 to 123 percent of the observed 1951–2010 change (USGCRP, 2017; Wigley and Santer, 2012). Similarly, the Fifth Assessment Report of the Intergovernmental Panel on Climate Change identified humans as the cause of at least 100 percent of observed warming (IPCC Synthesis Report, 2014). A contribution of greater than 100 percent indicates that some natural forces, such as volcanoes, are working to cool the Earth, but are being overwhelmed by the effects of greenhouse gases.
Climate change is directly responsible for many heat records.
Human-caused climate change has contributed to the severity and probability of 82 percent of record-hot days globally (Diffenbaugh et al. 2017). The Northern hemisphere’s extreme heatwave in 2018 was ‘impossible’ without climate change (Vogel et al. 2019). As for annual temperature records, the global heat record in 2016 could not have happened but for climate change (Knutson et al. 2018). Climate change is also responsible for marine warming in the Gulf of Alaska and the Bering Sea from 2014–16 (Walsh et al. 2018).
Scientists identified the fingerprint of anthropogenic climate change in the temperature pattern favoring planetary wave stalling.
This pattern leaves whole regions under the same weather for extended periods, which can turn hot spells into heat waves and wet weather into floods (Mann et al., 2017). Jet stream dynamics are not well captured in climate models, and some experts believe the models are underestimating the impact of climate change on persistent weather extremes.
NOTABLE IMPACTS
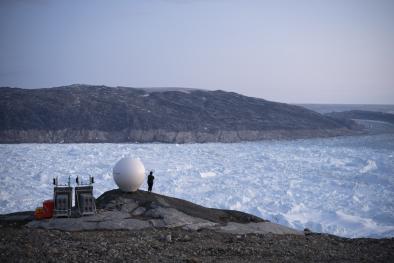
2010-2019: ARCTIC AMPLIFICATION
As the planet has heated, Arctic sea ice has declined. The lowest levels of Arctic sea ice were recorded in 2012, and 2019 has tied for the second-lowest levels. From mid-October to early November 2019, sea ice levels dropped below the 2012 record low for that period.
2011: TEXAS HEAT AND DROUGHT
Two of the first US-based climate change event attribution studies found that climate change increased the probability of the 2011 Texas heat wave and drought (Rupp et al. 2012 and Hoerling et al. 2012).
2012: MIDWEST HEAT WAVE
In March 2012, the Midwest experienced one of the biggest heat waves of all time. Climate change increased the likelihood of the 2012 Eastern US March-May heat event by a factor of 12 (Knutson et al. 2013). Climate change has also quadrupled the frequency of events like the 2012 hot summer over the north-central and northeastern US (Diffenbaugh et al. 2013)
2013: SOUTHWEST HEAT WAVE
In late June 2013, an intense heat wave struck the Southwestern United States. Various places in Southern California reached up to 122 °F. On June 30, Death Valley, California hit 129.2°F, which is the hottest temperature ever recorded on Earth during the month of June. It was five degrees shy of the world record highest temperature measured in Death Valley, which was 134°F, recorded in July 1913.
2014-2017: GLOBAL CORAL BLEACHING
Global warming triggered the Earth’s third global coral bleaching event, which began in the north Pacific in the summer of 2014 and became global in 2015. The fingerprint of global warming was found in this event (King 2016). Increased sea surface temperature bleached and killed corals, while ocean acidification simultaneously made it harder for reefs to recover.
2016: GLOBAL TEMPERATURE RECORD
2016’s record global January–December warmth would not have been possible under climate conditions of the early 1900s. Human-caused climate change was a necessary condition for the event (Knutson et al. 2018).
2016: ALASKA MARINE HEAT
Extreme Arctic warmth in 2016 would not have been possible without climate change (Kam et al. 2018). The 2016 marine heatwave off the coast of Alaska - which decimated marine ecosystems and led to the warmest winter-spring on record for coastal Alaskan communities - was unprecedented in the historical record, and could not have occurred without climate change (Walsh et al. 2018). Specifically, it was up to 50 percent more likely to occur because of climate change (Oliver et al. 2018).
2018: NORTH AMERICAN HEAT WAVE
Record‐breaking temperatures occurred concurrently in multiple regions including North America, Europe, and Asia in late spring/summer 2018. The extreme heat was an "unprecedented" hemispheric event that would not have happened without heat-trapping greenhouse gas pollution (Vogel et al. 2018).
Related Content


