US Severe Storms and Floods April - May 2017
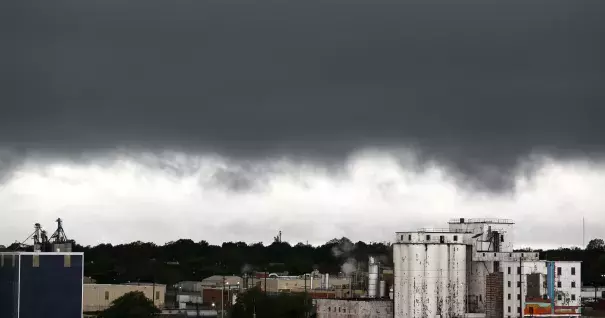
A major slow-moving storm brought heavy rains, dangerous winds, tornadoes, and flooding across much of the central US beginning April 28. States from Oklahoma to Indiana recorded extreme three-day rainfall totals of 5 to 11 inches.[1] Eastern Texas saw two EF-3 tornadoes and Kansas experienced a rare late-season blizzard. An impressively large area of 100- to 1,000-year rains hammered Missouri[2][4] and the Ozarks were hit by record-shattering flood crests. At least 20 people have been killed.[3]
Climate change is amplifying rainfall across all storm types. One of the clearest changes in the weather across the globe and in the US is the increasing frequency and intensity of heavy rain and snow. A warmer atmosphere holds more water, and storms supplied by climate change with increasing moisture are widely observed to produce heavier rain and snow. Climate change may also be linked to the persistence of slow-moving events such as this by driving changes in atmospheric circulation. While global warming may increase the fuel available for tornadoes, it is not yet possible to determine whether and how climate change may be affecting tornado activity. However, in a changing climate this uncertainty signifies increased risk.


Climate science at-a-glance
- Climate change loads storms with more rainfall, increasing the threat of flooding.
- A warmer atmosphere holds and dumps more moisture. Measurements of water vapor in the air during the storm were extraordinarily high.
- Increasing extreme precipitation is an observed global trend firmly attributed to climate change. This storm dumped a wide swath of 100- to 1,000-year rainfall.
- Flooding is increasing in both severity and frequency throughout much of the Mississippi and Missouri River Basins in connection with extreme rainfall.
- Extreme events driven by natural variability and amplified by climate change are consistent with what climate science projects in a warming world.
- Climate change may be linked to the slow-moving nature of events such as this by driving changes in atmospheric circulation.
- Climate change has been proposed as contributing to the clustering of tornado outbreaks in the United States; however, the scientific literature is not yet robust enough to link changes in tornado activity to climate change. In a changing climate, this uncertainty signifies increased risk due to global warming.
Central US hit by heavy rains, dangerous winds, tornadoes, and river flooding
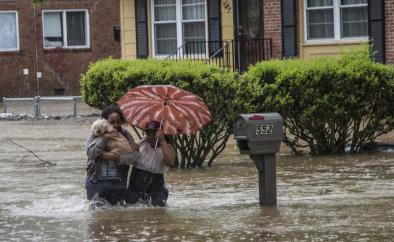
At least 20 people were killed and dozens more injured due to flooding, tornadoes and dangerously high winds in Missouri, Arkansas, Mississippi and Texas, according to The Weather Channel.[1]
Seven people died from flooding and winds in Arkansas, including a fire chief who was struck by a vehicle while working during the storm. Five deaths were reported in Missouri, including a woman who drowned after rushing water swept away her car. One of two deaths in Mississippi included a 7-year-old who died of electric shock, and a 2-year-old girl died in Tennessee after being struck by a soccer goal post thrown by heavy winds. There were 23 confirmed tornadoes from April 28 through May 1—EF0 (7); EF1 (13); EF2 (1); EF3 (1); EF4 (1); EF5 (0)—responsible for at least four deaths.[1][2]
At least 105,350 outages have been linked to the storm.[3]
Extreme precipitation is a clear signal of climate change
Atmospheric moisture observations
This "classic"[4] mid-latitude spring storm was likely supercharged by running through an atmosphere made wetter by global warming.
A measure of the amount of water in the air—known as the precipitable water content—was extraordinarily high during the storm, consistent with the finding that warmer air contains more water vapor than cooler air when saturated.
For example, the reading over Springfield, Missouri on April 30 at 7:00 am local time (12Z) was 1.54 inches, compared to a maximum average around this time of year (known as the moving average) of 1.43 inches.[5] The 1.54 inch measurement is among the top recorded precipitable water contents for this region in the month of April.[6]
In addition, unusually warm seas in the Caribbean—where sea surface temperatures were 1.8°F to 3.6°F above average—contributed moisture that was drawn into and fueled the storm.[7]
Of course there is a climate change connection, because the oceans and sea surface temperatures are higher now because of climate change, and in general that adds 5 to 10 percent to the precipitation.
– Kevin Trenberth, climate scientist with the National Center for Atmospheric Research[10]
Rain observations
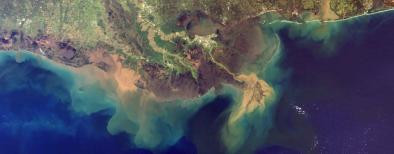
The major storm brought three-day rains of 5 to 11 inches to Arkansas, Missouri, Oklahoma, Louisiana, Kentucky, Indiana, and Illinois from April 28 through May 1.[8] Top rainfall totals include Rogers, Arkansas at 10.54 inches and Houston, Missouri at 11.15 inches.[8] Rainfall rates of several inches per hour were recorded as continuous bands of rain crossed multiple states, according to the reinsurance company, Aon Benfield.[2]
This event brought an impressively large area of 100- to 1000-year rains, which certainly played a leading role in producing such catastrophic flooding. To some, this storm may seem like a case of déjà vu. A remarkably similar storm system brought rains of remarkably similar magnitude to this same region in late December 2015.
– MetStat[9]

The creators of the Average Recurrence Interval (ARI) analysis at right, Metstat Inc., depict the relative rarity of events by comparing observed rainfall to rainfall frequency distributions. The ARI analysis shows that, in a 72-hour period starting at 1:00 a.m. local time (CDT) on April 26th and ending at 1:00 a.m. on May 1st, some areas received rainfall amounts on par with a 1-in-100 year event or more. The Ozarks and southern Illinois tended to be the hardest hit. Greater than 1-in-1000 year rains were seen east of Springfield.[9]
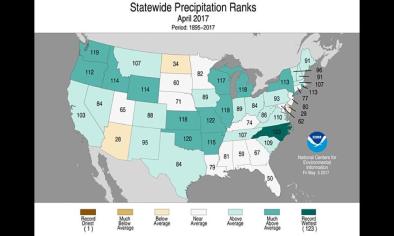
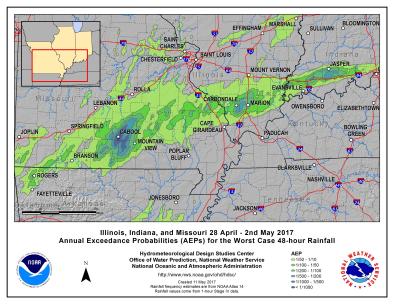
A NOAA AEP (annual exceedance probability) analysis—shown below—mapped a wide area of 1-in-100 year rainfall to 1-in-1000 year rainfall across Missouri as well as large stretches 1-in-100 year rainfall to 1-in-500 year rainfall extending across Illinois and Indiana.
There have been many so-called 500-year floods along the Mississippi about every five to 10 years since 1993.
– Kevin Trenberth, climate scientist with the National Center for Atmospheric Research[10]
 Bob Henson with Weather Underground reports that April 29 in Springfield, MO, was the wettest single spring day on record for that weather station (meteorological spring: March/April/May), with 4.31" of rainfall recorded. The second wettest day on record being May 22, 1989 when 4.21 inches were recorded.
Snow observations
The weather system also brought destructive blizzard conditions from the Texas panhandle to Nebraska, stranding vehicles, downing trees and power lines and whipping up snow drifts up to 8 feet in one of the strongest snowstorms to slam this area so late in the spring.[11] The one and two-day snow totals were among the heaviest on record in the month of April throughout the Plains.[2]
Related climate science
Studies show the amount of water vapor in the atmosphere has in fact increased.[12][13] Storms reach out and gather water vapor over regions that are 10-25 times as large as the precipitation area, thus multiplying the effect of increased atmospheric moisture.[14] The observed increases have been studied and formally attributed global warming.[15][16][17] One of the clearest changes in weather globally and across the United States is the increasing frequency of heavy rain.[18]
In the mid-latitudes, where most of the continental US is located, there is an upward trend in extreme precipitation in the vicinity of fronts associated with mid-latitude storms.[19]
An April 2017 study found that from 1961 to 2010, global warming increased the likelihood of occurrence of the wettest five-day periods on record in 41 percent of the observed areas globally.[20]
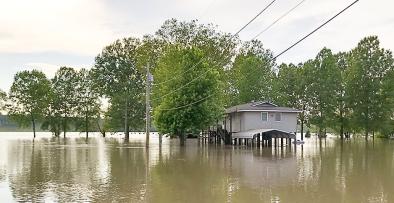
Heavy rainfall leads to record-breaking flood levels
Flood observations
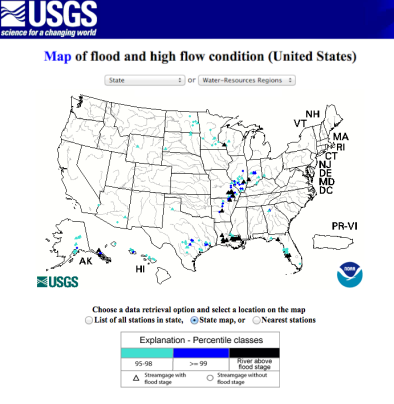
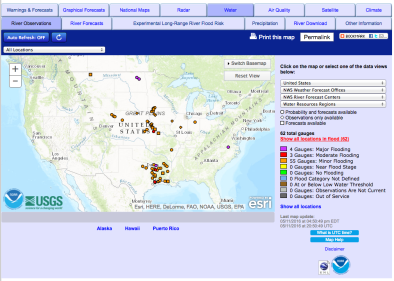
 No fewer than 10 individual river gauge locations set all-time record water crest heights during the events.[2] Some locations in southern Missouri shattered record crests that had stood for over 100 years.[21]
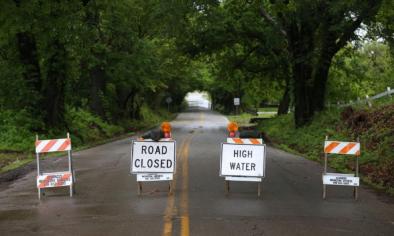
Flooding forced Missouri transportation officials to close Interstate 55, along with other major routes on May 3, effectively cutting off St. Louis from any roads to the south.
South of St. Louis, the Meramec River—a tributary of the Mississippi River—threatened low-lying communities. In Pacific, the water rose to about 33 feet on May 2, just short of the December 2015 record.[22] The river crested Tuesday night in Eureka at 46.11 feet, almost exactly at the 46.1-foot record from 16 months prior.[23]
The flooding was the worst seen since the deluge of December 2015 when an early winter downpour equaled the record totals of the Flood of 1993.[24][25] The Flood of 1993’s so-called 500-year totals—totals that historically have a 1 in 500 chance of occurring in any given year—has now been matched twice in less than two years.[24] Another flood of similar magnitude in 1995 puts the total at four 500-year floods in the past 24 years.[26]
Related climate science
A warmer atmosphere drives more extreme precipitation across all storm types, increasing the risk of flooding.[18] Extreme and record events driven by natural variability and amplified by climate change are consistent with what climate science projects in a warming world.
The Third US National Climate Assessment states that flooding is increasing in both severity and frequency throughout much of the Mississippi and Missouri River Basins and that increases in flood risk reflect both changing precipitation and changing land-use patterns.[18]
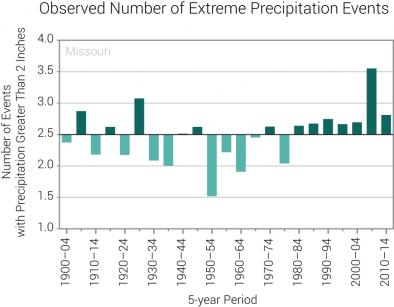
 In the Great Plains, the amount of precipitation falling in very heavy events (defined as the heaviest 1 percent of all daily events) increased by 16 percent from 1958 to 2012.[27] In the Midwest, extreme precipitation has increased by 37 percent.[27] An updated state-by-state analysis through 2015 reports that Missouri has witnessed an increase in extreme precipitation of more than 50% since 1950.[28] There has also been an observed jump in the number of days per year with more than 2 inches of rain in several cities in these regions since 1950,[29][30] as well as a steady increase in that measure nationwide.[31]

Climate change may amplify precipitation from slow-moving events like this one
Slow-moving features in the atmosphere contributed to the massive rainfall, including a deep trough in the jet stream—which allowed cold air and snow to seep down over the Rockies—and a broad ridge over the east, drawing up a plume of Caribbean moisture—where sea surface temperatures were 1.8°F to 3.6°F above average[7]—to inundate the Gulf coast and Mississippi Valley.[32]
There is evidence to suggest that global warming is slowing down planetary atmospheric waves, contributing to many extreme events of recent years.[33][34][35]
Flooding insurance payouts rising in parallel
In parallel with these weather trends, there has been a dramatic spike over recent years in claims filed with the National Flood Insurance Program. The 6 most expensive years in the 39-year history of Nat'l Flood Insurance payouts have all occurred since the year 2000, and eight of the top 15 years for total claims filed have also occurred since 2000.


Uncertainty around climate change impacts on tornadoes translates as increased risk
Storm data indicates that the number of tornadoes per outbreak in the United States may be increasing while the individual number of outbreaks may be decreasing.[36][37] Climate change has been proposed as contributing to this clustering; however, the scientific literature is not yet robust enough to link changes in tornado activity to climate change.
Climate model projections indicate that convective available potential energy (CAPE)—a measure of the amount of energy available for convection—would increase in a warmer climate leading to more frequent environments favorable to severe thunderstorms in the United States.[38][39]
However, a December 2016 study links recent increases in the number of tornadoes per outbreak, not to CAPE, but to trends in storm relative helicity,[36] a quantity related to vertical wind shear previously identified as a factor in increased year-to-year variability of US tornado numbers.[37]
The uncertainty about the climate change connection translates as an increased risk due to climate change.
Related Content