Hurricane Lane August 2018
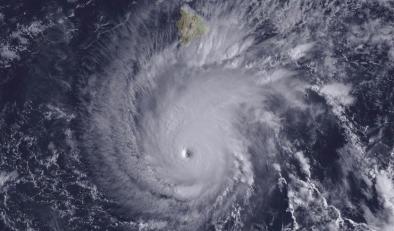
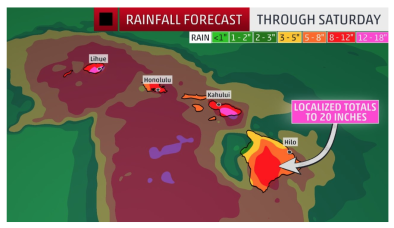
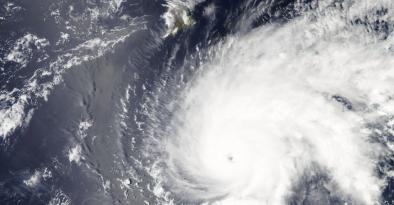
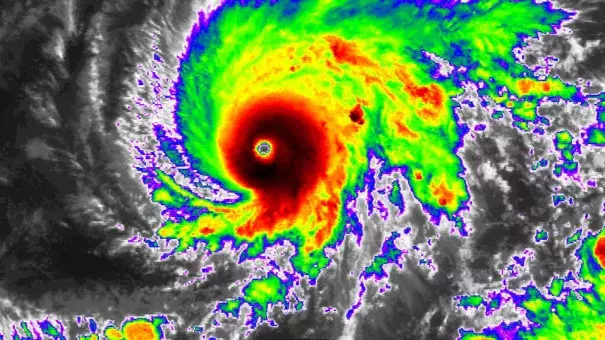
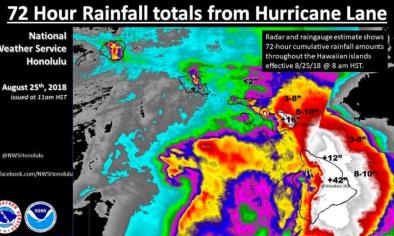
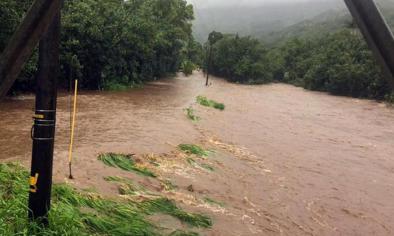
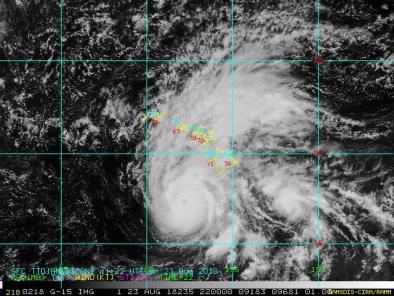
Hurricane Lane reached Category 5 strength on August 21 with top sustained winds near 160 mph and a minimum central pressure of 940 mb. On August 22, Hurricane Lane drew close to Hawaii, prompting hurricane warnings and watches on the islands. Though it never made landfall, the storm brought high winds, torrential rains, and major flooding to large parts of the state. With 52.02 inches of rain measured at one gauge on the Big Island, Lane was the second-wettest tropical cyclone ever recorded in the U.S., after Harvey.[1] It was only the 6th recorded Category 5 hurricane in this part of the Pacific and the nearest to Hawaii a Category 5 hurricane has ever been observed.[2]
Climate change affects hurricane activity and amplifies the damages in three ways: (1) increasing the rainfall that drops during the storm, (2) increasing sea surface temperatures which in turn raises the maximum potential energy that a storm can reach, and (3) elevating storm surge, via sea level rise, which greatly extends the storm's reach along low-lying areas.
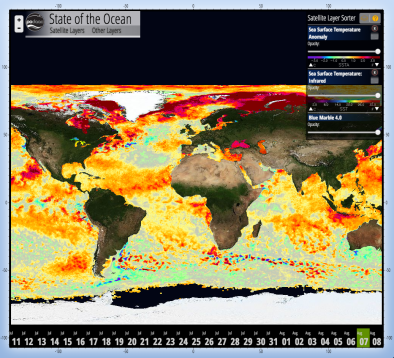
Sea surface temperatures on August 19, 2018 along the path of Hurricane Lane were as much as 4.5°F above the average from 1961 to 1990. Unprecedented storms such as Lane are more likely now due to global warming.


Climate science at a glance
- Increasing rainfall rates is one of the firmest projection of the impacts of climate change on storms.[1]
- Hurricane Lane was the second-wettest tropical cyclone ever recorded in the U.S., topped by only Harvey.[2]
- There has been a global increase in the observed intensity of the strongest tropical cyclones.[3]
- There is strong evidence that climate change may be responsible for the recent observed increase in the intensity, as measured by wind speeds and central pressure, of tropical cyclones.
- Climate change has raised sea surface temperatures in the central Pacific significantly, increasing the maximum potential energy of passing hurricanes and driving more moisture into those storms, fueling rainfall. Sea surface temperatures on August 19, 2018 along the path of Hurricane Lane were as much as 4.5°F above the average from 1961 to 1990
- Two studies have identified the fingerprint of global warming in fueling the intensity of hurricanes in the Hawaiian region.[4][5]
- Damage incurred by tropical cyclones is overwhelmingly and disproportionately incurred by the most powerful storms, indicating that overall damage will increase as the climate warms.
- Sea level rise has significantly extended the reach of storm surge and coastal flooding driven by hurricanes.
Background information
Hurricane activity near Hawaii
Hawaii’s hurricane experience is limited. Tropical cyclones often weaken as they approach Hawaii due to cooler water temperatures, drier and more stable air, and an increase in wind shear (the change in wind speed and/or direction with height).[6] This makes strong hurricanes close to Hawaii an unusual occurrence.
Only two direct hurricane landfalls have been recorded in Hawaii, both on Kauai: Category 1 Dot in 1959 and catastrophic Category 4 Iniki in 1992.[7]
Hurricane Lane is the second category 5 hurricane on record to pass within 350 miles (or less) of South Point, Hawaii.[8] The only other storm to do that is Hurricane John in 1994.[8]
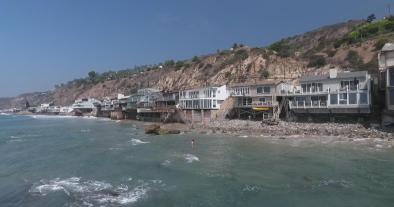
Wind damage and flash flooding from torrential rains are the main threats from hurricanes in the Hawaiian Islands. Storm surge is less of a threat compared to Atlantic hurricanes hitting the US coast. This is because the Hawaiian Islands are surrounded by deep water that prevents a storm surge from building to large heights.[7]
Climate signals breakdown
Climate signals #1 and #2: Sea Surface Temperature Increase and Intense Hurricane, Frequency Increase
 Hurricanes are fueled by ocean heat. As climate change warms sea surfaces, the heat available to power hurricanes has increased, raising the limit for potential hurricane wind speed and with that an exponential increase in potential wind damage.
The link between warming ocean temperatures and stronger storms may be reflected in the close correlation between observed trends in recent sea surface temperatures and observed trends in the intensity of tropical cyclones.[3][9][10]
In the Central Pacific, recent hurricane seasons have been unusually active. Two studies have identified the fingerprint of global warming in fueling the intensity of hurricanes in the Hawaiian region.[4][5]
Observations consistent with climate signals #1 and #2
- The Northeast Pacific (to 180°) hurricane season has now generated more Accumulated Cyclone Energy (ACE) in August 2018 than in any other August on record. The prior August ACE record was set in 1972.[11]
- Sea surface temperatures on August 19, 2018 along the path of Hurricane Lane were as much as 4.5°F above the average from 1961 to 1990.[12]
- Pacific Ocean sea surface temperatures have been much above average during the summer of 2018. Scientists at the Scripps Pier have been recording historic temperatures in the Pacific Ocean as high as 79.5°F. That's about 10 degrees above normal.[13]While warmer El Niño conditions are tentatively forecast to emerge last this year, current El Niño conditions across the Pacific are neutral.
- Lane comes on the heels of Hurricane Hector, which nearly reached Category 5 strength in its run by Hawaii earlier in August.[14]
Climate signal #3: Extreme Precipitation
 Climate change is fueling extreme rainfall and dramatically increasing rainfall across many types of storms.[15]
One of the clearest changes in weather globally is the increasing frequency of heavy rain.[16]
As the global average temperature increases, so too does the ability of the atmosphere to hold and dump more water when it rains.[15] Atmospheric water vapor has been increasing,[17][18] and the observed increases have been studied and formally attributed to global warming.[19][20][21]
Storms reach out and gather water vapor over regions that are 10-25 times as large as the precipitation area.[15] As water vapor condenses to form clouds and rain, the conversion releases heat that adds buoyancy to the air and further fuels the storm.[22] This increases the gathering of moisture into storm clouds and further intensifies precipitation.[15]
Observations consistent with climate signal #3
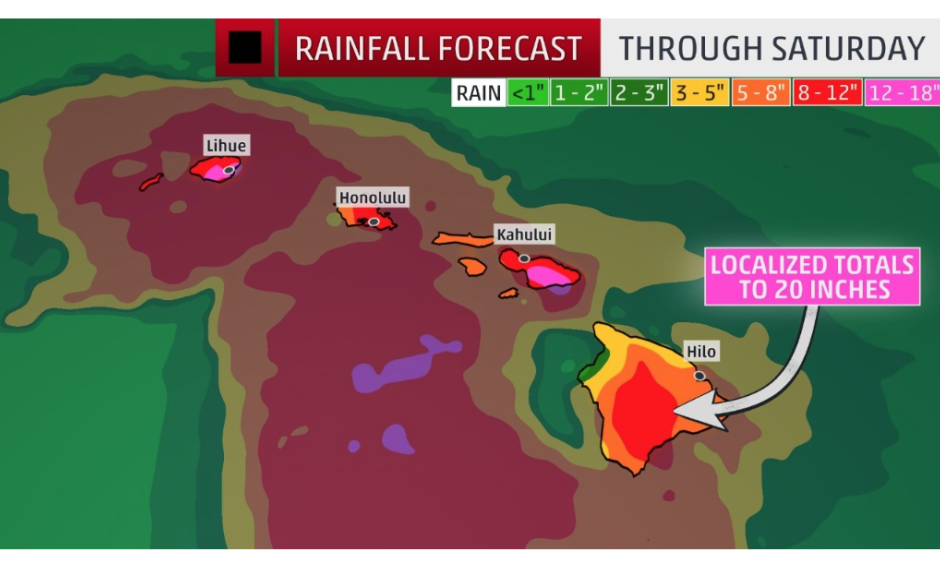
- With 52.02 inches of rain measured at one gauge on the Big Island, Lane was the second-wettest tropical cyclone ever recorded in the U.S., topped only by Harvey.[2]
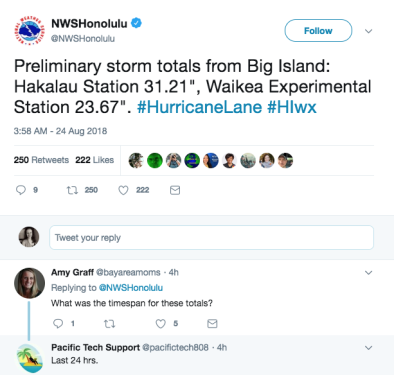
- Preliminary storm totals from Big Island through August 23: Hakalau Station 31.21 inches, Waikea Experimental Station 23.67 inches.[23]
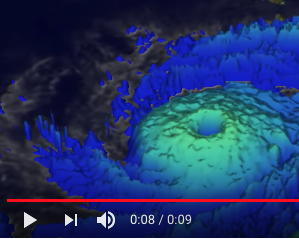
- The Global Precipitation Measurement satellite passed over Hurricane Lane when it was a Category 5 hurricane in the Central Pacific Ocean. GPM found very heavy rain occurring in powerful storms located in Lane’s well defined eye wall. Moderate to heavy rainfall was also covering a large area extending outward from the eye.[25]
Climate signal #4: Storm Surge Increase
Climate change has already contributed about 8 inches (0.19 meters) to global sea level rise,[19] and this has dramatically amplified the impact of cyclones by increasing baseline elevations for waves and storm surge.[19][26][27][28]
A small vertical increase in sea level can translate into a very large increase in horizontal reach by storm surge depending upon local topography. In Hawaii, storm surge is less of a threat compared to Atlantic hurricanes hitting the US coast, since the Hawaiian Islands are surrounded by deep water that prevents a storm surge from building to large heights.[7]
Still, locally hazardous storm surge impacts were forecast across south and west facing coasts of the islands.[24]
Climate signal #5: Large scale circulation change
Studies have shown that atmospheric circulation over the Pacific Ocean (called Walker Circulation) is weakening[29] and that this weakening accompanies human-caused sea surface temperature (SST) rise[30] in the tropical and subtropical central Pacific.[31][32] Given the stronger surface warming, studies have projected a corresponding increase in the frequency of tropical cyclone genesis over the basin in a warmer environment.[32]
Observations consistent with climate signal #5
- Sea surface temperatures on August 19, 2018 along the path of Hurricane Lane were as much as 4.5°F above the average from 1961 to 1990.[12]
Related Content