Hurricane Barry 2019
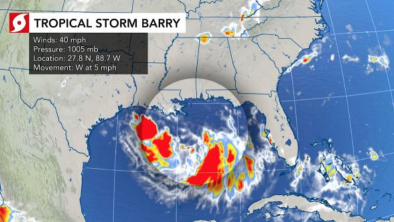
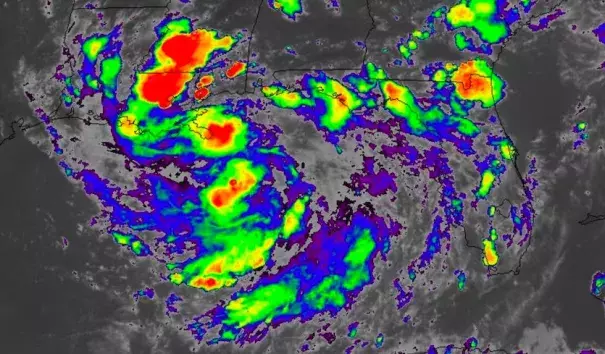
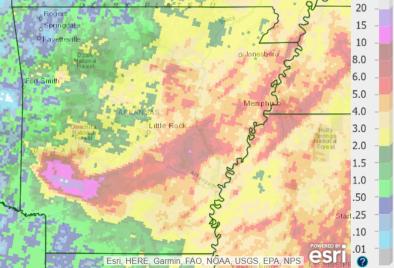
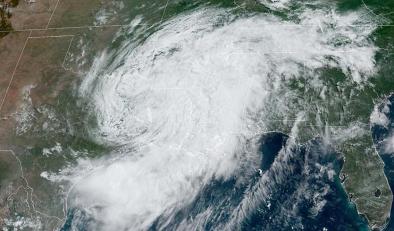
Hurricane Barry, the second storm of the 2019 Atlantic hurricane season, made landfall in south central Louisiana on July 13 as a Category 1 hurricane with 75 mph winds. Barry’s remnants dropped 16.17 inches in Arkansas, the fifth state to post a new tropical storm or hurricane rainfall record since 2017, joining Texas, Hawaii, North Carolina and South Carolina. Unusually warm waters in the Gulf, up to 4°F warmer than the historic average, will fuel the intense rainfall.
At the time of Barry's landfall, the Lower Mississippi River had already been at flood stage for the longest period on record. That flooding was driven by relentless seasonal rain across the central US exacerbated by climate change that had kept the river in flood stage since last October. For the third time in 2019, the record was broken for the wettest 12-month period in the US; almost 8 inches wetter than average.[1]


Climate science at a glance
- Increasingly heavy downpours are one of the clearest impacts of climate change on extreme weather, and one of the most dangerous.
- Barry’s rainfall will amplify ongoing flooding on the Mississippi.
- Sea level rise is rapidly increasing storm surge and coastal flood risk along US coastlines, one of the costliest climate impacts.
- From 2016 to 2018, rain has pushed aside storm surge as the top source of hurricane-related deaths.
- Climate change increases the risk of compound extreme events that have a multiplying effect on society, the environment, and infrastructure.
- Infrastructure built to withstand the storms of the past can collapse as new extremes overwhelm and push infrastructure past design thresholds.
Climate signal breakdown
Climate signal #1: Extreme precipitation increase
One of the clearest changes in weather globally is the increasing frequency of heavy rain. As the global average temperature increases, so too does the ability of the atmosphere to hold and dump more water when it rains.[1] Atmospheric water vapor has been increasing.[2][3] And the observed increases have been studied and formally attributed to global warming.[4][5][6]
From 1958 to 2016, the amount of precipitation falling in very heavy events (the top 1 percent of all daily precipitation events) increased by 27 percent in the Southeast.[7] Climate change increased the extreme three day precipitation observed in South Louisiana from August 12 to 14, 2016 by as much as 20 percent.[8][9]
Over the period from 1994-2008, extreme precipitation events linked to hurricanes accounted for more than 33 percent of the observed increase in heavy events across the US.[10] The Southeast in particular saw a 40 percent increase in the amount of precipitation falling in the heaviest events, and 100 percent of this increase is linked to hurricane events.[10]
Storms reach out and gather water vapor over regions that are 10-25 times as large as the precipitation area, thus multiplying the effect of increased atmospheric moisture.[1] As water vapor condenses to form clouds and rain, the conversion releases heat that adds buoyancy to the air and further fuels the storm.[11] This increases the gathering of moisture into storm clouds and further intensifies precipitation.[1]
Scientists have found that global warming increased the rainfall rates for many individual hurricanes, including Hurricanes Ivan[12], Katrina[12][13], Sandy[14], Harvey[15][16][17][18][19], Irma[12] and Maria.[12]
The increase in extreme precipitation has increased the threat of flooding, dramatically illustrated by the 1,000-year rainfall dropped by Hurricanes Matthew, Harvey, and Florence. Inland cities near large rivers in the US now experience more flooding, and this shift is consistent with climate change.
Observations consistent with climate signal #1
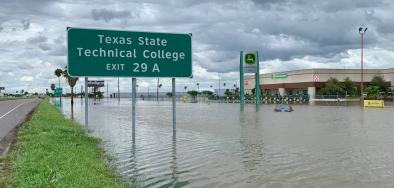
- Barry’s remnants dropped 16.17 inches in Arkansas, the fifth state to post a new tropical storm or hurricane rainfall record since 2017, joining Texas, Hawaii, North Carolina and South Carolina.[28]
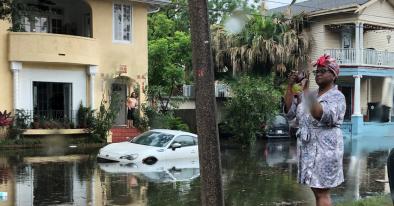
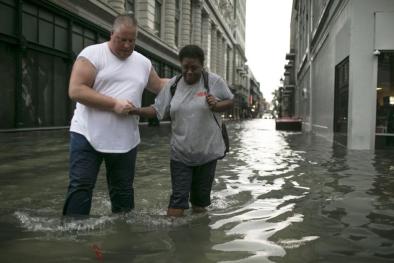
- On July 10, in the lead up to Barry, the official rainfall in New Orleans was more than 7 inches over the span of six hours. In some areas, the rain fell at more than 6 inches an hour, which is several times the rate than can be pushed by the city’s pumps into Lake Pontchartrain.[20][21]
- Water temperatures were “reflective of August normals rather than what would be expected in July,” according to Rob Perillo, Chief Meteorologist for KATC.
Climate signal #2 and #3: Sea level rise and increased storm surge
Higher sea levels permit storm surge from tropical storms to travel farther inland than in the past, impacting more coastal properties and infrastructure.
Climate change has already contributed about 8 inches (0.19 meters) to global sea level rise,[4] and this has dramatically amplified the impact of cyclones by increasing baseline elevations for waves and storm surge.[4][22][23][24] A small vertical increase in sea level can translate into a very large increase in horizontal reach by storm surge depending upon local topography.
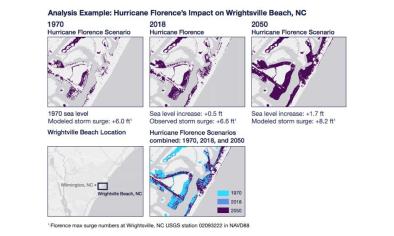
For example, an analysis by the First Street Foundation found that sea level rise was responsible for 11,000 (20 percent) of the homes impacted by Florence's storm surge.[25] During Superstorm Sandy, sea level rise extended Sandy's storm surge by 27 square miles, affecting 83,000 additional individuals living in New Jersey and New York City[22] and adding over $2 billion in storm damage.[24] Hurricane Matthew set several storm tide records during its approach to the eastern seaboard.
Observations consistent with climate signals #2 and #3
- The highest surge levels, in the 6’ – 7’ range, occurred along the Atachafalaya River from around Morgan City southward.[26]
- Two levee overtopping events occurred in far southeast Louisiana.[26]
Climate signal #4: Compound flooding increase
Climate change increases the risk of compound extreme events that have a multiplying effect on society, the environment, and infrastructure. The number of compound extremes (co-occurrence of multiple events) has increased significantly over the past century at many of the major coastal cities.[27]
Current risk management does not typically consider the impact of compound extremes and the risk of cascading infrastructure failure.
Observations consistent with climate signals #4
- Barry’s storm surge is likely to inundate coastal regions already experiencing days of heavy rain and ongoing flooding along the Mississippi River, setting the stage for dangerous compound flooding.
Related Content