Mississippi River Valley Floods 2019
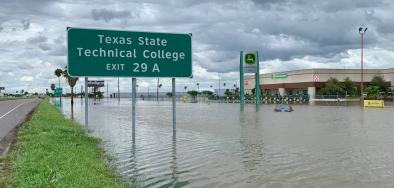
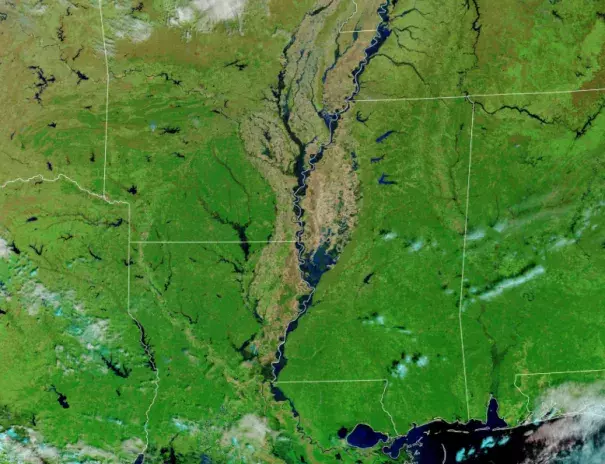
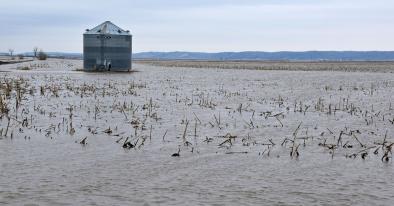
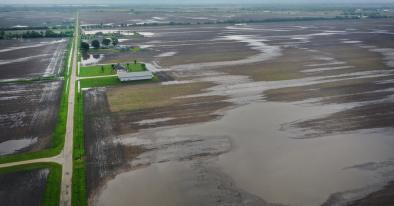
2019 saw the most prolonged and widespread flooding in US history. The Upper Mississippi River, Arkansas River, and Missouri River, which drain into the Lower Mississippi, all flooded, and each ranked on the National Oceanic and Atmospheric Administration’s list of billion-dollar weather and climate disasters. Collectively, the flood events cost an estimated 20 billion dollars and caused nearly 20 million acres of farmland to go unplanted, disrupting rural economies across the country as well as the communities they support.[1]
Several river gauges set records for the greatest length of time water levels remained at major flood stage. It is a stark example of the risks the United States now faces due to the environmental disruption caused by climate change. Significant increases in flooding are well-documented in the Midwest. These increases are attributed mostly to the observed increases in total precipitation. There is also increasing evidence to suggest that the persistent jet stream behavior behind some of the record setting precipitation events is more likely due to human-caused climate change.
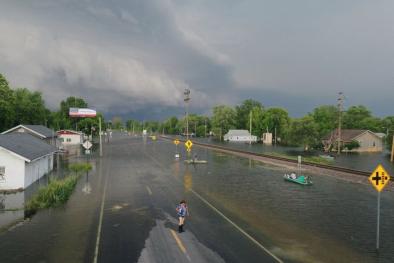
There were three major rounds of flooding between March and September. In many cases, communities flooded more than once, with barely any time in between to clean up or prepare for another flood. In March, parts of the Midwest and northern US states were hit with a “bomb cyclone” that dropped immense amounts of snow and rain in a short period of time. The Mississippi River flooding from spring through July was the longest flood on record, breaking the 1927 Great Flood record.


Climate science at a glance
 The extended flooding of the Mississippi River is a classic signal of climate change.
- Significant increases in flooding are well-documented in the Midwest. These increases are attributed mostly to the observed increases in total precipitation.
- A warmer atmosphere can hold more moisture, and can lead to more intense storms. In the Central U.S., severe storms are showing an increase in intensity and frequency, consistent with climate modeling.
- A growing body of scientific evidence has made clear that "increasing precipitation, especially heavy rain events," across the Midwest and Great Plains "has increased the overall flood risk, causing disruption to transportation and damage to property and infrastructure."[2]
- Persistent jet-stream patterns are expected to occur more often with a warming climate, and especially as the Arctic warms faster than elsewhere.
- Heavy rainfall is increasing in our warming world, and it is driving up flood risk. Warming temperatures are changing when and how rapidly snow melts.
- The dams and levees that were breached were designed for the climate of the past, not today’s climate.
- Infrastructure tends to collapse when climate change pushes extreme weather past the limits for which projects were designed.
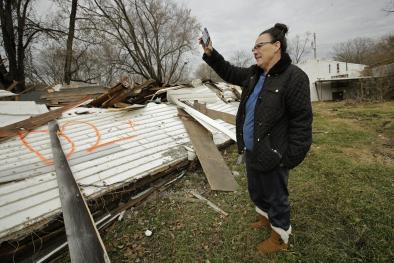
The 2019 Disasters are difficult to overstate. The impacts of 2019 were basin-level: 14 million people displaced, 19.3 million acres unplanted, over $20 billion in damages across the Ohio and Missouri River Valleys.
Climate signal breakdown
Climate signals #1: Precipitation increase
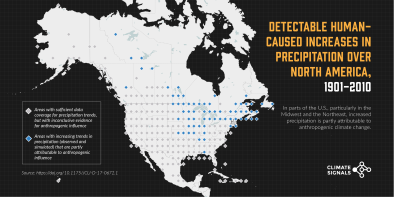
Extreme precipitation is increasing worldwide as the warming atmosphere is holding and dumping more water when it rains. Across the United States, observational data shows an increase in the intensity and frequency of extreme precipitation events.[1]
Statistically significant increases in flooding are well-documented in the Midwest.[2][3][4][5][6][7] These increases in flood risk and severity are not attributed to 20th century changes in agricultural practices, but instead are attributed mostly to the observed increases in total precipitation.[2][8][9][10][11]
Modeling studies consistently suggest that the frequency and intensity of severe storms in the United States could increase with climate change, particularly over the Midwest and southern Great Plains during spring.[12][13][14][15]
Observations consistent with climate signals #1
- From winter through early spring, the Valley received three times as much rainfall as normal[1], and the heavy precipitation events continued. By early May, the Mississippi River had been in major flood stage for over 40 days.[2] Since the beginning of the year, the Upper Mississippi Valley picked up between one and two feet of rain, while the Lower Mississippi Valley has seen more than two feet of rain.[3] Isolated spots have received over 40 inches of rain.[4]
- The 12 months spanning May 2018 through April 2019 were the wettest year-long period in the United States in records dating back to 1895, according to the monthly U.S. climate summary issued May 8 by the NOAA's National Centers for Environmental Information.[19]
- In mid-May, storms brought 4 to 9 inches of precipitation to the Central U.S. where the ground was already saturated. In parts of Kansas, Oklahoma and Missouri, the water rose quickly, trapping people in homes and vehicles.[16]
- In late April, the upper Mississippi was inundated with massive amounts of rain, exacerbating already high river levels. "The state of Iowa has received more precipitation in the last 12 months than any recorded period in 124 years of data," said Bob Gallagher, the mayor of the upriver town of Bettendorf.[17] At the time, the Mississippi River had been at major flood stage for 41 days and counting.[17]
- By March 21 when NOAA released its "Spring Outlook," the upper Mississippi Valley had received spring rain and snow up to 200 percent above normal.[18]
- During the "bomb cyclone" in mid-March, twice as much rain fell as is normal for the area. The Weather Service’s Omaha office recorded 1.37 inches. More fell to the north and west, with Norfolk, getting 2.27 inches March 12 through 14.
Climate signal #2: Runoff and flood risk increase
More intense rainfall events and regional increases in precipitation linked to climate change are increasing the risk of extreme runoff and flooding in some locations. Precipitation is a major driver for river discharge trends and for changes across annual and decadal time scales.
 Observations consistent with climate signal #2
- In Baton Rouge, Louisiana, the river first rose above flood stage in the first week of January, and has been above that threshold ever since, a record-long stretch that could extend well into June, topping the longevity record from 1927.[19]
- The Mississippi River went above flood stage in Vicksburg, Mississippi, on February 17, and has remained in flood stage ever since (as of May 23).[19] The National Weather Service said this is the longest continuous stretch above flood stage since 1927 at Vicksburg.[19]
- As of May 21, the National Weather Service River Forecast Center predicted just under 400 locations with gauges along rivers in the U.S. (18 percent of all U.S. Geological Survey river gauges) would experience some level of flooding by later in the week, covering an impressive area from the northern Plains and upper Midwest to the Gulf Coast.[16]
- The Bonnet Carré Spillway, about 27 miles upriver from New Orleans, had to be used for the 13th time in its history and the first time in consecutive years. It's also the fourth time the spillway was used in a single decade – the most in its history.[19]
- Several gauges have set records for the greatest length of time water levels have remained at major flood stage, including: the Quad Cities of Iowa and Illinois; Baton Rouge, Louisiana; New Boston, Illinois; Keithsburg, Illinois; and Burlington, Iowa.[19][20]
- In mid-March, after heavy precipitation during the "bomb cyclone," over 40 locations setting new record river levels, mainly in Nebraska and Iowa.[21]
Climate signal #3: Rapid snowpack melt
Global warming affects snow and ice cover by increasing the amount of precipitation falling as rain instead of snow and by hastening snowmelt.
In Nebraska, snow cover has decreased, in part because of warmer temperatures causing earlier melt and increasing the amount of precipitation that falls as rain rather than snow.[22]
A climate change fingerprinting study looking at Northern Hemisphere snow cover extent found that it has decreased primarily due to the earlier onset of spring since the 1970s,[23] and that this decrease is at least partially driven by climate change.[24] As climate change leads to earlier snowmelt and more precipitation falling as rain instead of snow, the risk of major floods increases.
Observations consistent with climate signals #3
- The weekend of March 9 and 10, temperatures in the Midwest warmed up to the high 30s, and many places experienced widespread snowmelt of two to three inches.[25][26] Some places had the equivalent of six inches of water in 24 hours. Days later, the “bomb cyclone” rolled in, and the warmer temperatures caused rain to fall instead of snow, bringing an additional two inches of water to the region.
Climate signals #4 and #5: Large scale global circulation change and Arctic amplification
When wacky weather strikes, it's always the jet stream that's causing it. The jet stream is responsible for almost all weather in the U.S., except for the formation and intensity of tropical storms and highly local effects. The jet stream is powered by the temperature difference between the Arctic and the mid-latitudes, and this difference is shrinking as the Arctic warms. Scientists suspect this may be making the jet stream slow down and meander, rather than speeding around the planet as it usually does. A slower, more meandering jet stream leads to more persistent weather patterns, which can cause record temperatures and precipitation.
During the spring of 2019, the Arctic has been much warmer than normal, especially on the Pacific side. This leads to a stronger ridge in the eastern Pacific and can cause the entire pattern across North America to stick around well beyond its welcome.
Observations consistent with climate signals #4 and #5
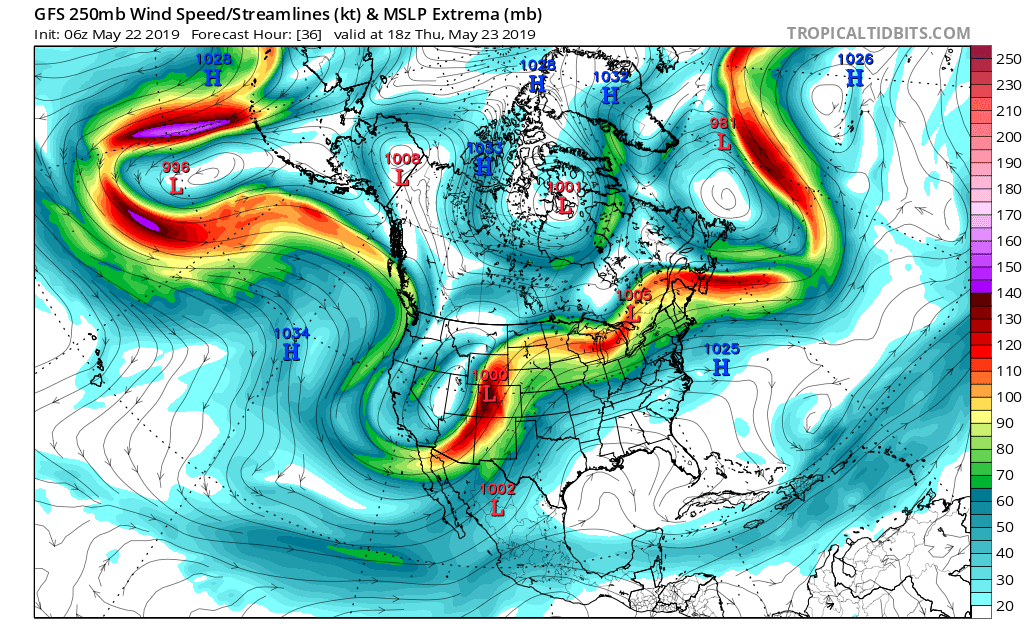
- In late May, a very persistent jet-stream pattern (pictured to the right)—with a deep trough (southward dip) in the west and a strong ridge (northward bulge) in the east—brought heavy precipitation to the central U.S.
- On March 13 ahead of the "bomb cyclone", the jet stream was very kinked over the U.S., with strong winds from two jet streams — the subtropical jet and polar jet streams — joining to create the storm. The polar jet was extremely wavy across the northern hemisphere, and is consistent with the unusual jet stream behavior expected due to Arctic warming.

Rose Andreatta
Rose Andreatta is the director of the Climate Signals project and has over a decade of experience translating scientific information into usable formats for a variety of audiences. Rose earned her Master’s of Public Administration in Environmental Science and Policy at Columbia University and holds a Certificate of Achievement in Weather Forecasting from Pennsylvania State University.
Related Content