

Sea Level Rise
Global warming is behind the recent acceleration of sea level rise observed since record keeping began in 1880. The ocean, which has absorbed 93 percent of the heat that human activities have added to the climate system, expands as it warms, which pushes up sea levels. Warming also melts glaciers and ice sheets on land, with the run-off adding to sea levels.
Read More


Climate science at a glance
- Global sea level rise due to climate change is driving flooding much further inland along low-lying areas and increases the risk of coastline erosion.
- Sea level rise, combined with coastal storms, elevates and dramatically extends the storm surge driven by hurricanes – the main driver of damage for coastal regions.[1][2]
Background information
Recent sea level rise in historical context
The recent increasing rate of global sea level rise stands in stark contrast to the prior 2,000 years, when there was little change.[3]
 The graph to the right shows four periods of sea level change since about 100 BC: (1) stable sea level from 100 BC to 950 AD; (2) a 400-year period lasting until 1350 AD when sea level rose at a rate of 0.6 mm/yr; (3) a roughly stable period from 1350 AD up to 1880; and (4) the period since the late 19th century when sea level has risen at an average rate of 2.1 mm/yr.[3]
A March 2016 study found sea levels are rising at the highest rate in roughly 3000 years, accelerated by climate change.[4] The study found that in pre-industrial times, sea levels never rose more than 3 inches (76 mm) above the 2000 year average. In contrast, in the 20th century alone, sea levels rose 5.5 inches (140 mm).[4]
A September 2014 paleoclimate study looking at marine sediments determined the rate of sea level rise since around 1880 is unmatched by any period in the past 6,000 years.[5]
Regional trends and projections
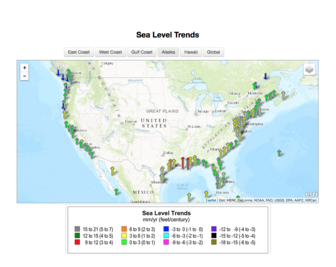
Regional sea levels vary based on regional and local changes in land movement and long-term changes in coastal circulation patterns.
The Atlantic coast is a hotspot of accelerated sea level rise and flooding.[6][7] Many East Coast cities have regional rates of sea level rise that are substantially above the global rate due to land subsidence and differences in geography which amplify the local effect of global sea level rise.[8]
Sea level has risen about a foot over south Florida in the past century; a foot and a half over New York City; and nearly three feet over the Mississippi Delta and Galveston. With forecasts of at least 1-2 feet of further sea level rise by mid-century and rapidly accelerating through this century and beyond, our future of living in the coastal zone will be defined/limited by increasingly frequent and intense storm erosion, surges, and inundations.
Dr. Harold R. Wanless, Professor and Chair, Department of Geological Sciences, University of Miami
Climate change is driving global sea level rise
- (Walker et al. 2022): Globally, it is very likely that rates of sea-level rise emerged above pre-industrial rates by 1863, which is similar in timing to early ocean warming and glacier melt.
- The 2019 IPCC Special Report on the Ocean and Cryosphere in a Changing Climate finds that total global mean sea level rise for 1902–2015 is 6.3 inches (0.16 meters).[9]
- The rate of sea level rise for 2006–2015 of 0.14 inches (3.6 mm per year), is unprecedented over the last century, and about 2.5 times the rate for 1901–1990 of 0.10 inches (1.4 mm) per year.[9]
- The sum of ice sheet and glacier contributions over the period 2006–2015 is the dominant source of sea level rise (0.07 inches or 1.8 mm per year), exceeding the effect of thermal expansion of ocean water (0.10 inches or 1.4 mm per year).[9]