Precipitation Falls as Rain Instead of Snow
With incremental warming, significant fractions of snowfall events shift to rainfall events.[1] Rising temperatures have a larger effect at locations and elevations near the freezing level where small changes in temperature can determine whether snowpack melts and whether precipitation falls as rain or snow.[2]
Read More
Warm snow drought
Temperature and precipitation both affect water supplies. "Warm snow drought" refers to reductions in water resources due to warmer temperatures, which reduce snowpack, while "dry snow drought" refers to reductions driven by decreases in precipitation.[1]
With incremental warming, significant fractions of snowfall events shift to rainfall events.[2] Rising temperatures have a larger effect at locations and elevations near the freezing level where small changes in temperature can determine whether snowpack melts and whether precipitation falls as rain or snow.[3]
Western United States
Weather systems passing through California originate globally, and the average global increase in temperature has been 1°C, indicating significant risk that storms arriving in California may be warming and converting additional snow pack to mountain run-off. Rain-on-snow-producing atmospheric river storms are, on average, only 2°C warmer than others storm types that preserve snowpack.[4]
Because winter temperatures in the Sierra Nevada mountains are often near the thawing threshold, a small difference in the temperature of passing weather systems often determines whether precipitation falls as snow or rain.[4]
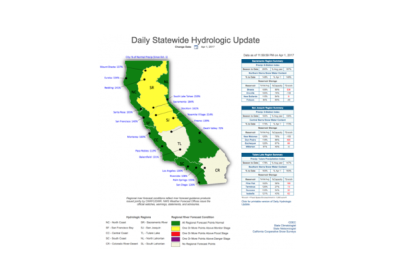
Measuring the amount of water stored in snowpack
The ratio of snowpack (measured in snow water equivalent) to overall precipitation (SWE/P) is an indicator of a temperature-driven snow-melt signal on western US snowpack.[3] The SWE/P ratio shows what fraction of current water year precipitation remains in the snowpack for any given day of the water year: the closer SWE (snow water equivalent) is to P (overall precipitation), the more water resources remain.[3]