Glacier and Ice Sheet Melt
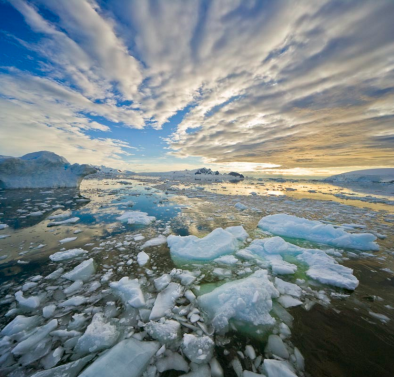
The melting of ice sheets and glaciers around the world is accelerating and contributing to rising sea levels. Melting in Greenland is particularly dramatic, with the record year of 2012 witnessing surface melt far in excess of any earlier year in the satellite record. For a few days that year, 97 percent of the entire ice sheet indicated surface melting. Antarctica too is vulnerable to global warming and is melting despite being the coldest place on Earth. Melting of the Antarctic ice sheet serves as a valuable climate indicator, as well as a potential source of dangerous sea level rise, and may accelerate if key ice shelves continue to be lost.
Read More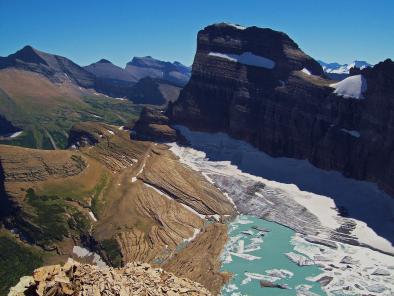

Climate science at a glance
- Ice sheets contain enormous quantities of frozen water.
- The mass of ice in the Greenland Ice Sheet his declining.
- A large area of the West Antarctic Ice Sheet is also losing mass, probably because of warmer water deep in the ocean near the Antarctic coast.
- Knowledge of the mechanisms controlling the rate of ice loss in Greenland and Antarctica is limited, making it difficult for scientists to narrow the range of expected future sea level rise.
- It is possible that the warming to date has already passed the tipping point that eventually leads to major losses from the Antarctic and Greenland Ice Sheets.
Background
What are ice sheets?
An ice sheet is a mass of land ice extending more than 20,000 square miles (50,000 square kilometers). The two ice sheets on Earth today cover most of Greenland and Antarctica, and together contain more than 99 percent of the freshwater ice on Earth. As long as an ice sheet accumulates the same mass of snow as it loses to the sea, it remains stable.
What are ice shelves?
Ice shelves are floating sheets of ice that are permanently attached to a landmass. Massive floating sections of ice skirt about 75 percent of the Antarctic coastline, where they act as a buttress against ice flow from inland. Like much of the rest of the ice in the polar regions, these buttresses are weakening in some parts of Antarctica, as witnessed most dramatically at the Larsen A and B ice shelves, which collapsed rapidly in 1998 and 2002, when roughly 1250 square miles of ice fragmented and collapsed in little over a month. Larsen C has retreated significantly since the 1980s.
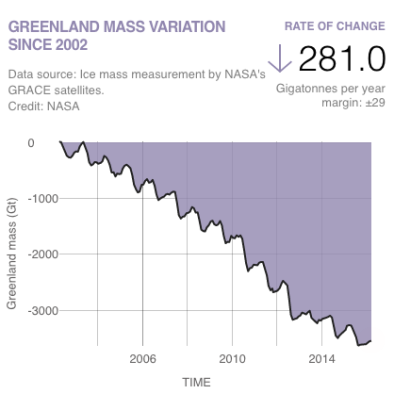
Greenland ice sheet melt trends
The Greenland ice sheet and its 240 marine-terminating glaciers are among the largest bodies of fresh water on the planet. According to the IPCC, the average rate of ice sheet melt from the Greenland ice sheet has substantially increased from 34 gigatons a year over the period 1992 to 2001 to 215 gigatons a year over the period 2002 to 2011.[1]
Recent trends show that Greenland’s melt is accelerating, even in parts of the ice sheet once thought to be stable. A large region in the northeast of the ice sheet was stable until 2003, then changed abruptly to melting at a rate of 10 gigatons per year.[2] The melt rate is now 15 to 20 gigatons per year and rising.
The IPCC has found that the warming threshold for near-complete loss of the Greenland Ice Sheet is somewhere between 1.8 to 7.2°F (1 to 4°C), but the uncertainty is so great that a likely range cannot be established.[1]
It is likely that during the last interglacial period, when the global mean temperature never exceeded 3.6°F (2°C) above recent pre-industrial conditions, the Greenland Ice Sheet contributed up to 10 feet to sea levels.[1] Full melt would contribute sea level rise of about 23 feet.[1]
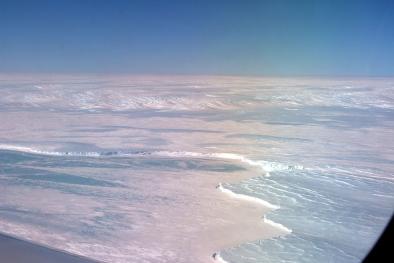
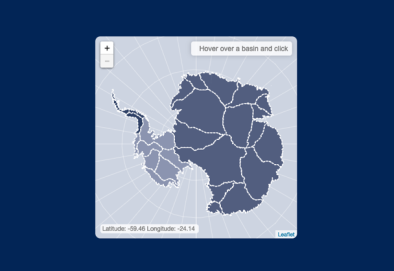
Antarctic ice sheet melt trends
Since the 1930s, the upper 1,000m of the Southern Ocean that surrounds Antarctica has warmed significantly in conjunction with climate warming.[3] Scientists estimate the subsurface water in the Southern Ocean may be warming faster than any other part of the ocean.[3] Warmer ocean water has led to the recent acceleration of melt on the West Antarctic Ice Sheet.
(IPCC, AR6, 2021, 9-64): The Antarctic Ice Sheet lost 2670 Gt (a sea level equivalent of 7.4 mm) of ice between 1992 and 2020. The rate of ice sheet mass loss rose from 0 Gt per year in 1901– 1990 to 192 Gt per year (a sea level equivalent 0.54 mm per year ) for 2006–2018. The mass-loss rate was on average 49 Gt per year over the period 1992–1999, 70 Gt per year over the period 2000–2009 and 148 Gt per year. over the period 2010–2016.[4]
(IPCC, SROCC, 2019): The acceleration, retreat and thinning of the principal West Antarctic outlet glaciers has dominated the observed Antarctic mass loss over the last decades, and stated with high confidence that these losses were driven by melting of ice shelves by warm ocean waters.[5]
(Rignot et al., 2019): Major contributions to recent Antarctic ice sheet changes arise from West Antarctica and Wilkes Land in East Antarctica.
(Rignot et al., 2019; Bamber et al., 2018; Mohajerani et al., 2018): While the mass balance of the East Antarctic ice sheet is close to zero, the Totten Glacier in East Antarctica has lost mass in the last two decades.
Ice sheet trends and tipping points
(Dowdeswell et al., 2020): Changes in parts of the Antarctic ice sheet can occur over multi-century time scales (in less than 2000 years).
(Good et al. 2018): Some degree of irreversible loss of the West Antarctic Ice Sheet may have already begun.